
The Week That Was
More record highs for several indices and increasing risk appetite ensued as hopes for a U.S./Iran ceasefire agreement led to falling oil prices and lower Treasury yields, while AI momentum continued. The Nasdaq led the charge, up 2.4%, while the R2K advanced 1.8%, the MDY and SPX gained 1.5% and the DJIA was 0.9% higher.
Corporate earnings continued to post remarkable y/y growth fueled by increasing AI adoption resulting in significant price hikes for SNOW, NTAP, DELL - even beleaguered software names were catching a bid after CRM posted earnings that showed in-line revenue growth and stable margins and strong growth in its AI-related products.
Inflation data was in line with estimates, though remains elevated. Headline PCE rose 0.4% m/m in April, down from 0.7% in March, while the y/y rate increased to 3.8%, the highest since May 2023. Core PCE rose 0.2% m/m and 3.3% y/y, also the hottest annual reading since late 2023. Personal spending rose 0.5%, while personal income was flat. A second cut at 1Q26 GDP was revised down to a 1.6% y/y pace from the initial 2.0% estimate, due to weaker investment and consumer spending. Durable goods orders were strong, rising 7.9% in April, helped by a 21.5% jump in transportation orders, though core capital goods orders fell 1.1%. New home sales fell to 622K and initial jobless claims rose to 215K.
Fixed income yields declined marginally on the in-line inflation numbers as well as hopes for declining energy prices with the 10-year Treasury yield declining 5 bp's to 4.47%. Markets are now pricing in roughly a 60% chance of a rate hike this year, with a full hike priced by April 2027, and the implied neutral fed funds rate has moved near 4.00% (CME). WTI crude oil declined more than 10% as markets priced in a potential U.S.-Iran agreement. Gold moved higher as expectations for a Fed rate hike eased slightly on truce hopes, while silver steadied and remains on pace for a May gain. The USD rose for the month despite weakening over the last five days as the euro and British pound strengthened.
U.S. Equity Market Summary — As of 5/29/26
| Asset Class | 1 Wk | 1 Mo | 3 Mo | YTD | 1 Yr | 3 Yr | 5 Yr |
|---|---|---|---|---|---|---|---|
| S&P 500 | 1.82% | 6.35% | 10.52% | 11.27% | 29.78% | 23.37% | 14.15% |
| Dow Jones Industrials | 1.49% | 4.60% | 4.64% | 6.86% | 22.92% | 17.67% | 10.19% |
| NASDAQ | 2.58% | 9.40% | 19.19% | 16.33% | 41.53% | 28.51% | 15.27% |
| S&P MidCap 400 | 2.26% | 4.18% | 4.56% | 13.27% | 25.44% | 16.88% | 8.08% |
| Russell 2000 | 2.67% | 6.68% | 11.26% | 18.15% | 42.53% | 19.74% | 6.61% |
| Russell Micro Cap | 3.06% | 9.73% | 13.92% | 21.58% | 61.41% | 24.22% | 6.52% |
U.S. Sector Summary — As of 5/29/26
| Cyclical Sectors | 1 Wk | 1 Mo | 3 Mo | YTD | 1 Yr | 3 Yr | 5 Yr |
|---|---|---|---|---|---|---|---|
| Consumer Cyclical | 1.83% | 3.45% | 3.63% | 1.42% | 13.33% | 17.68% | 7.81% |
| Financials | -0.29% | -0.65% | 0.80% | -5.34% | 2.99% | 19.01% | 8.17% |
| Materials | 2.26% | 0.37% | -3.81% | 13.28% | 20.80% | 12.47% | 5.30% |
| Real Estate | -1.15% | 0.80% | 1.01% | 9.75% | 9.16% | 10.95% | 3.69% |
| Sensitive Sectors | 1 Wk | 1 Mo | 3 Mo | YTD | 1 Yr | 3 Yr | 5 Yr |
|---|---|---|---|---|---|---|---|
| Comm. Services | -0.35% | 0.35% | -1.69% | -1.41% | 15.98% | 24.35% | 9.08% |
| Energy | -4.80% | -4.64% | 1.31% | 26.71% | 41.26% | 16.36% | 20.97% |
| Industrials | 1.52% | 1.88% | -1.99% | 11.92% | 22.92% | 22.55% | 12.18% |
| Technology | 6.95% | 20.06% | 37.83% | 32.84% | 65.87% | 33.27% | 23.45% |
| Defensive Sectors | 1 Wk | 1 Mo | 3 Mo | YTD | 1 Yr | 3 Yr | 5 Yr |
|---|---|---|---|---|---|---|---|
| Consumer Defensive | -2.07% | -0.01% | -7.37% | 7.33% | 3.77% | 7.00% | 5.95% |
| Health Care | 0.89% | 4.64% | -6.31% | -3.05% | 14.94% | 7.20% | 5.56% |
| Utilities | -1.29% | -2.76% | -6.29% | 4.77% | 12.65% | 14.65% | 9.66% |
US Equity Style Summary — As of 5/29/26
| Equity Style | 1 Wk | 1 Mo | 3 Mo | YTD | 1 Yr | 3 Yr | 5 Yr |
|---|---|---|---|---|---|---|---|
| Large Growth | 2.40% | 8.43% | 16.70% | 10.30% | 30.55% | 27.16% | 15.37% |
| Large Blend | 1.94% | 6.51% | 10.77% | 10.98% | 29.49% | 23.61% | 13.76% |
| Large Value | 1.34% | 4.06% | 2.76% | 11.54% | 26.46% | 18.74% | 11.30% |
| Mid Growth | 3.36% | 7.62% | 7.43% | 7.23% | 12.37% | 16.79% | 6.69% |
| Mid Blend | 1.99% | 4.05% | 3.53% | 9.24% | 18.88% | 17.26% | 7.84% |
| Mid Value | 0.94% | 1.38% | 0.63% | 10.28% | 23.19% | 17.20% | 8.61% |
| Small Growth | 3.43% | 8.58% | 11.12% | 17.90% | 35.10% | 19.01% | 5.69% |
| Small Blend | 2.47% | 5.13% | 6.28% | 14.24% | 29.95% | 18.18% | 7.22% |
| Small Value | 1.71% | 2.54% | 2.72% | 11.49% | 26.09% | 17.50% | 8.19% |
International Equity Market Summary — As of 5/29/26
European equities edged higher, with the STOXX Europe 600 up 0.1% as Germany's DAX rose 0.9%, France's CAC 40 gained 0.8%, and Italy's FTSE MIB advanced 1.1%. The FTSE 100 declined 0.5% in a shortened week. Europe's macro backdrop remained mixed as ECB minutes suggested policymakers were open to raising rates, and officials warned that the energy shock had been large and persistent. German unemployment unexpectedly declined to 6.3% in May, though its labor agency still expects joblessness to rise over the next few months. Italy's first-quarter GDP growth was revised up to 0.3%, supported by domestic demand and exports. EU passenger-car registrations rose 5.1% y/y in April reflecting strong consumer demand for EV's, while U.K. shop price inflation accelerated to 1.2% y/y as shipping and raw material costs remained elevated.
Japan surged, with the Nikkei 225 up 4.7% and the TOPIX gaining 1.7%, helped by easing Middle East risk and renewed strength in technology and AI-linked shares. Tokyo core CPI slowed to 1.3% y/y in May, below consensus and below the BoJ's 2% target for a fourth straight month, complicating the near-term rate-hike debate. The 10-year JGB yield fell to 2.66% from 2.76% as softer domestic inflation and global bond-market relief reduced the inflation risk premium. The yen was little changed near JPY 159.3 versus USD.
China was mixed as stronger industrial profits were offset by greater regulatory pressure on offshore financial accounts. The CSI 300 rose 1.0%, while the Shanghai Composite fell 1.1%. Industrial profits jumped 24.7% y/y in April, accelerating from 15.8% in March, helped by energy, raw materials, and technology-related exports. However, consumer-facing industries and property activity remained weak. Regulatory scrutiny of offshore online brokerages serving China investors pressured brokerage shares and risk appetite. Hong Kong's Hang Seng was down 1.7% during a shortened trading week.
| Region | 1 Wk | 1 Mo | 3 Mo | YTD | 1 Yr | 3 Yr | 5 Yr |
|---|---|---|---|---|---|---|---|
| MSCI ACWI | 1.64% | 6.16% | 7.69% | 12.35% | 30.70% | 22.40% | 11.97% |
| MSCI ACWI ex USA | 2.01% | 5.71% | 2.74% | 14.36% | 32.43% | 20.05% | 8.80% |
| MSCI Emerging Markets | 3.96% | 8.46% | 9.39% | 25.61% | 52.64% | 24.60% | 7.79% |
| MSCI Europe | 0.81% | 4.39% | -0.98% | 6.81% | 20.23% | 16.69% | 8.96% |
| MSCI Asia Pacific | 3.27% | 7.97% | 6.92% | 22.87% | 43.89% | 22.71% | 8.35% |
| MSCI Latin America | -0.14% | -2.85% | -5.47% | 13.18% | 40.15% | 15.76% | 10.24% |
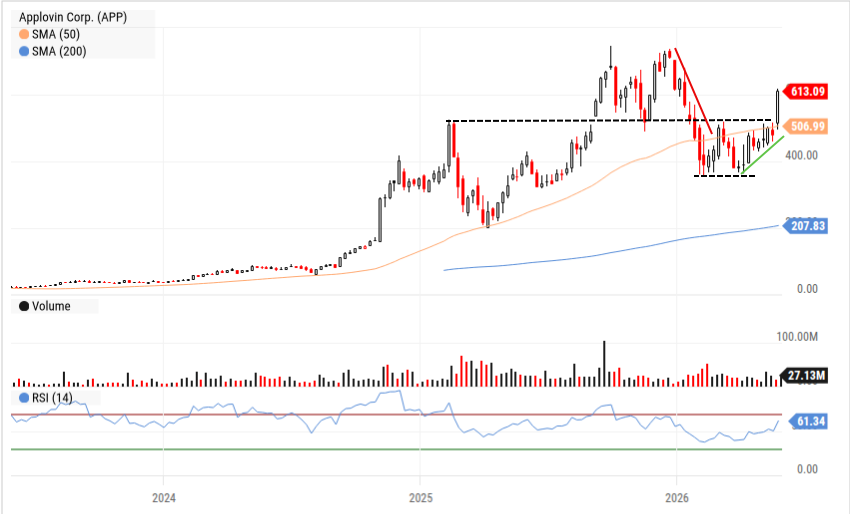
Chart of the Week — 6/1/26
APP has been consolidating after a steep drawdown and is now breaking thru intermediate resistance. We believe a move back to old highs could be in the offing.
The Week Ahead
June is in full bloom, just like earnings have been for the past 6 weeks or so. The IGV's recovery above its 150dma last week could foretell a return of capital into the broader enterprise software space beyond the security names which have already recovered. We see names such as ORCL, MSFT, NOW, APP, WDAY, and maybe even CRM, as worthy of consideration as the AI hardware related names all look quite extended at this point.
HPE, AVGO, CRWD and CIEN are the high profile earnings reports this week in technology followed closely by takes on the consumer from DG, ULTA, FIVE and LULU. There is alot not to like about the consumer sector currently (war, gas price, inflation, etc) but we have to admit that breakouts in the airlines (DAL, UAL), autos (F, GM) and the steadfastness of the hotels (MAR, H, HLT) give us pause to consider that the worst case scenario has long been discounted and we need to be on the lookout for emerging narratives.
The US labor market will be the focus of data this week as JOLTS (Tues), ADP (Wed), Challenger Job Cuts (Thur) and Non-Farm Payrolls (Fri) will provide a mosaic for the Fed to consider at its next meeting June 16/17. From our viewpoint, the no hire/no fire status quo looks like the most plausible scenario though a small uptick last week in new/continuing jobless claims — as we have sporadically over the past year, only to have it recede — gives us pause.
Investors interest in regional economic activity reports from the Fed's Beige Book (Wed) will be high as it will provide anecdotal color/context to bewilderingly strong economic data that underlies the recent Atlanta Fed GDPNow estimate of 4+%.
| Company | Date | EPS Est. |
|---|---|---|
| Hewlett Packard Enterprise Co. (HPE) | Mon Jun 1 | $0.58 |
| Dollar General Corp. (DG) | Tue Jun 2 | $1.98 |
| Palo Alto Networks, Inc. (PANW) | Tue Jun 2 | $0.94 |
| Ulta Beauty, Inc. (ULTA) | Tue Jun 2 | $6.23 |
| Medtronic Plc (MDT) | Wed Jun 3 | $1.39 |
| Broadcom Inc. (AVGO) | Wed Jun 3 | $3.19 |
| CrowdStrike Holdings, Inc. (CRWD) | Wed Jun 3 | $1.16 |
| Five Below, Inc. (FIVE) | Wed Jun 3 | $1.13 |
| Brown-Forman Corp. (BF.B) | Thu Jun 4 | $0.38 |
| Ciena Corp. (CIEN) | Thu Jun 4 | $1.58 |
| DocuSign, Inc. (DOCU) | Thu Jun 4 | $1.06 |
| lululemon athletica, Inc. (LULU) | Thu Jun 4 | $2.69 |
| Data Release | Date | Est. |
|---|---|---|
| US ISM Manufacturing PMI | Mon Jun 1 | 53.0 |
| US Construction Spending YoY | Mon Jun 1 | 0.4% |
| US Job Openings: Total Nonfarm | Tue Jun 2 | 6.8M |
| ADP Employment Change | Wed Jun 3 | 75K |
| Federal Reserve Beige Book | Wed Jun 3 | N/A |
| US Challenger Job Cuts | Thu Jun 4 | 90K |
| US Total Nonfarm Payrolls | Fri Jun 5 | 102K |
| US Average Hourly Earnings YoY | Fri Jun 5 | 3.5% |
| US Oil Rig Count | Fri Jun 5 | N/A |
Key Interest Rates — As of 5/29/26
| Rate | As of | Latest | 1 Mo Ago | 1 Mo % | 1 Yr Ago | 1 Yr % |
|---|---|---|---|---|---|---|
| 1 Month Treasury | 5/29/26 | 3.72% | 3.68% | 1.1% | 4.34% | -14.3% |
| 2 Year Treasury | 5/29/26 | 3.98% | 3.92% | 1.5% | 3.92% | 1.5% |
| 10 Year Treasury | 5/29/26 | 4.45% | 4.42% | 0.7% | 4.43% | 0.5% |
| 30 Year Mortgage | 5/28/26 | 6.53% | 6.23% | 4.8% | 6.86% | -4.8% |
| US Corporate AAA | 5/28/26 | 4.99% | 4.94% | 1.0% | 4.88% | 2.3% |
| US Corporate BBB | 5/28/26 | 5.30% | 5.25% | 1.0% | 5.52% | -4.0% |
| US Corporate CCC | 5/28/26 | 13.42% | 13.00% | 3.2% | 12.86% | 4.4% |
| Effective Fed Funds | 5/28/26 | 3.62% | 3.64% | -0.5% | 4.33% | -16.4% |
US Economy Indicators
| Indicator | As of | Latest | 1 Mo Ago | 1 Mo % | 1 Yr Ago | 1 Yr % |
|---|---|---|---|---|---|---|
| Consumer Sentiment | 4/30/26 | 49.80 | 56.60 | -12.0% | 52.20 | -4.6% |
| Unemployment Rate | 4/30/26 | 4.30% | 4.40% | -2.3% | 4.20% | 2.4% |
| Inflation Rate (CPI YoY) | 4/30/26 | 3.80% | 2.40% | 58.3% | 2.30% | 65.2% |
| Manufacturing PMI | 4/30/26 | 52.70 | 52.40 | 0.6% | 48.70 | 8.2% |
| Non-Manufacturing PMI | 4/30/26 | 53.60 | 56.10 | -4.5% | 51.60 | 3.9% |
| Retail Sales ($M) | 4/30/26 | 656,115 | 641,038 | 2.4% | 623,635 | 5.2% |
| Building Permits (K) | 4/30/26 | 1,442 | 1,540 | -6.4% | 1,445 | -0.2% |
Suggested Readings
- 1Institute for the Study of War: Iran Update Special Report, June 1, 2026
- 2The Groupthink Boom: What Three Top VCs Really Think About the AI Frenzy
- 3Next Power Move In China's SE Asia Strategy is Nuclear
- 4What the Sulphuric Acid Supply Crunch Means for Critical Minerals
- 5Golden Dome is the Missile Defense the US Needs
Leadership Insight
“...One of the things that we're seeing in food and sundries where we're really leaning in is kind of anything protein right now is doing extremely well. So protein snacks, protein bars, beef sticks. We launched our own Kirkland Signature Beef Stick that's doing tremendous volume and offering tremendous value to our members.”
Stocks to Watch
For our full list of Stocks To Watch, contact Patrick Mullin at pmullin@timberpointcapital.com
More record highs for several indices and increasing risk appetite ensued as hopes for a U.S./Iran ceasefire agreement led to falling oil prices and lower Treasury yields, while AI momentum continued. The Nasdaq led the charge, up 2.4%, while the R2K advanced 1.8%, the MDY and SPX gained 1.5% and the DJIA was 0.9% higher.
Corporate earnings continued to post remarkable y/y growth fueled by increasing AI adoption resulting in significant price hikes for SNOW, NTAP, DELL - even beleaguered software names were catching a bid after CRM posted earnings that showed in-line revenue growth and stable margins and strong growth in its AI-related products.
Inflation data was in line with estimates, though remains elevated. Headline PCE rose 0.4% m/m in April, down from 0.7% in March, while the y/y rate increased to 3.8%, the highest since May 2023. Core PCE rose 0.2% m/m and 3.3% y/y, also the hottest annual reading since late 2023. Personal spending rose 0.5%, while personal income was flat. A second cut at 1Q26 GDP was revised down to a 1.6% y/y pace from the initial 2.0% estimate, due to weaker investment and consumer spending. Durable goods orders were strong, rising 7.9% in April, helped by a 21.5% jump in transportation orders, though core capital goods orders fell 1.1%. New home sales fell to 622K and initial jobless claims rose to 215K.
Fixed income yields declined marginally on the in-line inflation numbers as well as hopes for declining energy prices with the 10-year Treasury yield declining 5 bp's to 4.47%. Markets are now pricing in roughly a 60% chance of a rate hike this year, with a full hike priced by April 2027, and the implied neutral fed funds rate has moved near 4.00% (CME). WTI crude oil declined more than 10% as markets priced in a potential U.S.-Iran agreement. Gold moved higher as expectations for a Fed rate hike eased slightly on truce hopes, while silver steadied and remains on pace for a May gain. The USD rose for the month despite weakening over the last five days as the euro and British pound strengthened.
| Asset Class | 1 Wk | 1 Mo | 3 Mo | YTD | 1 Yr | 3 Yr | 5 Yr |
|---|---|---|---|---|---|---|---|
| S&P 500 | 1.82% | 6.35% | 10.52% | 11.27% | 29.78% | 23.37% | 14.15% |
| Dow Jones Industrials | 1.49% | 4.60% | 4.64% | 6.86% | 22.92% | 17.67% | 10.19% |
| NASDAQ | 2.58% | 9.40% | 19.19% | 16.33% | 41.53% | 28.51% | 15.27% |
| S&P MidCap 400 | 2.26% | 4.18% | 4.56% | 13.27% | 25.44% | 16.88% | 8.08% |
| Russell 2000 | 2.67% | 6.68% | 11.26% | 18.15% | 42.53% | 19.74% | 6.61% |
| Russell Micro Cap | 3.06% | 9.73% | 13.92% | 21.58% | 61.41% | 24.22% | 6.52% |
| Sector | 1Wk | YTD |
|---|---|---|
| 1.83% | 1.42% | |
| -0.29% | -5.34% | |
| 2.26% | 13.28% | |
| -1.15% | 9.75% |
| Sector | 1Wk | YTD |
|---|---|---|
| -0.35% | -1.41% | |
| -4.80% | 26.71% | |
| 1.52% | 11.92% | |
| 6.95% | 32.84% |
| Sector | 1Wk | YTD |
|---|---|---|
| -2.07% | 7.33% | |
| 0.89% | -3.05% | |
| -1.29% | 4.77% |
| Style | 1 Wk | 1 Mo | 3 Mo | YTD | 1 Yr | 3 Yr | 5 Yr |
|---|---|---|---|---|---|---|---|
| Large Growth | 2.40% | 8.43% | 16.70% | 10.30% | 30.55% | 27.16% | 15.37% |
| Large Blend | 1.94% | 6.51% | 10.77% | 10.98% | 29.49% | 23.61% | 13.76% |
| Large Value | 1.34% | 4.06% | 2.76% | 11.54% | 26.46% | 18.74% | 11.30% |
| Mid Growth | 3.36% | 7.62% | 7.43% | 7.23% | 12.37% | 16.79% | 6.69% |
| Mid Blend | 1.99% | 4.05% | 3.53% | 9.24% | 18.88% | 17.26% | 7.84% |
| Mid Value | 0.94% | 1.38% | 0.63% | 10.28% | 23.19% | 17.20% | 8.61% |
| Small Growth | 3.43% | 8.58% | 11.12% | 17.90% | 35.10% | 19.01% | 5.69% |
| Small Blend | 2.47% | 5.13% | 6.28% | 14.24% | 29.95% | 18.18% | 7.22% |
| Small Value | 1.71% | 2.54% | 2.72% | 11.49% | 26.09% | 17.50% | 8.19% |
June is in full bloom, just like earnings have been for the past 6 weeks or so. The IGV's recovery above its 150dma last week could foretell a return of capital into the broader enterprise software space beyond the security names which have already recovered. We see names such as ORCL, MSFT, NOW, APP, WDAY, and maybe even CRM, as worthy of consideration as the AI hardware related names all look quite extended at this point.
HPE, AVGO, CRWD and CIEN are the high profile earnings reports this week in technology followed closely by takes on the consumer from DG, ULTA, FIVE and LULU. There is alot not to like about the consumer sector currently (war, gas price, inflation, etc) but we have to admit that breakouts in the airlines (DAL, UAL), autos (F, GM) and the steadfastness of the hotels (MAR, H, HLT) give us pause to consider that the worst case scenario has long been discounted and we need to be on the lookout for emerging narratives.
The US labor market will be the focus of data this week as JOLTS (Tues), ADP (Wed), Challenger Job Cuts (Thur) and Non-Farm Payrolls (Fri) will provide a mosaic for the Fed to consider at its next meeting June 16/17. From our viewpoint, the no hire/no fire status quo looks like the most plausible scenario though a small uptick last week in new/continuing jobless claims — as we have sporadically over the past year, only to have it recede — gives us pause.
Investors interest in regional economic activity reports from the Fed's Beige Book (Wed) will be high as it will provide anecdotal color/context to bewilderingly strong economic data that underlies the recent Atlanta Fed GDPNow estimate of 4+%.
| Company | Date | EPS Est. |
|---|---|---|
| Hewlett Packard Enterprise Co. (HPE) | Mon Jun 1 | $0.58 |
| Dollar General Corp. (DG) | Tue Jun 2 | $1.98 |
| Palo Alto Networks, Inc. (PANW) | Tue Jun 2 | $0.94 |
| Ulta Beauty, Inc. (ULTA) | Tue Jun 2 | $6.23 |
| Medtronic Plc (MDT) | Wed Jun 3 | $1.39 |
| Broadcom Inc. (AVGO) | Wed Jun 3 | $3.19 |
| CrowdStrike Holdings, Inc. (CRWD) | Wed Jun 3 | $1.16 |
| Five Below, Inc. (FIVE) | Wed Jun 3 | $1.13 |
| Brown-Forman Corp. (BF.B) | Thu Jun 4 | $0.38 |
| Ciena Corp. (CIEN) | Thu Jun 4 | $1.58 |
| DocuSign, Inc. (DOCU) | Thu Jun 4 | $1.06 |
| lululemon athletica, Inc. (LULU) | Thu Jun 4 | $2.69 |
| Data Release | Date | Est. |
|---|---|---|
| US ISM Manufacturing PMI | Mon Jun 1 | 53.0 |
| US Construction Spending YoY | Mon Jun 1 | 0.4% |
| US Job Openings: Total Nonfarm | Tue Jun 2 | 6.8M |
| ADP Employment Change | Wed Jun 3 | 75K |
| Federal Reserve Beige Book | Wed Jun 3 | N/A |
| US Challenger Job Cuts | Thu Jun 4 | 90K |
| US Total Nonfarm Payrolls | Fri Jun 5 | 102K |
| US Average Hourly Earnings YoY | Fri Jun 5 | 3.5% |
| US Oil Rig Count | Fri Jun 5 | N/A |
European equities edged higher, with the STOXX Europe 600 up 0.1% as Germany's DAX rose 0.9%, France's CAC 40 gained 0.8%, and Italy's FTSE MIB advanced 1.1%. The FTSE 100 declined 0.5% in a shortened week. Europe's macro backdrop remained mixed as ECB minutes suggested policymakers were open to raising rates, and officials warned that the energy shock had been large and persistent. German unemployment unexpectedly declined to 6.3% in May, though its labor agency still expects joblessness to rise over the next few months. Italy's first-quarter GDP growth was revised up to 0.3%, supported by domestic demand and exports. EU passenger-car registrations rose 5.1% y/y in April reflecting strong consumer demand for EV's, while U.K. shop price inflation accelerated to 1.2% y/y as shipping and raw material costs remained elevated.
Japan surged, with the Nikkei 225 up 4.7% and the TOPIX gaining 1.7%, helped by easing Middle East risk and renewed strength in technology and AI-linked shares. Tokyo core CPI slowed to 1.3% y/y in May, below consensus and below the BoJ's 2% target for a fourth straight month, complicating the near-term rate-hike debate. The 10-year JGB yield fell to 2.66% from 2.76% as softer domestic inflation and global bond-market relief reduced the inflation risk premium. The yen was little changed near JPY 159.3 versus USD.
China was mixed as stronger industrial profits were offset by greater regulatory pressure on offshore financial accounts. The CSI 300 rose 1.0%, while the Shanghai Composite fell 1.1%. Industrial profits jumped 24.7% y/y in April, accelerating from 15.8% in March, helped by energy, raw materials, and technology-related exports. However, consumer-facing industries and property activity remained weak. Regulatory scrutiny of offshore online brokerages serving China investors pressured brokerage shares and risk appetite. Hong Kong's Hang Seng was down 1.7% during a shortened trading week.
| Region | 1 Wk | 1 Mo | 3 Mo | YTD | 1 Yr | 3 Yr | 5 Yr |
|---|---|---|---|---|---|---|---|
| MSCI ACWI | 1.64% | 6.16% | 7.69% | 12.35% | 30.70% | 22.40% | 11.97% |
| MSCI ACWI ex USA | 2.01% | 5.71% | 2.74% | 14.36% | 32.43% | 20.05% | 8.80% |
| MSCI Emerging Markets | 3.96% | 8.46% | 9.39% | 25.61% | 52.64% | 24.60% | 7.79% |
| MSCI Europe | 0.81% | 4.39% | -0.98% | 6.81% | 20.23% | 16.69% | 8.96% |
| MSCI Asia Pacific | 3.27% | 7.97% | 6.92% | 22.87% | 43.89% | 22.71% | 8.35% |
| MSCI Latin America | -0.14% | -2.85% | -5.47% | 13.18% | 40.15% | 15.76% | 10.24% |
| Rate | Latest | 1 Mo Ago | 1 Mo % | 1 Yr Ago | 1 Yr % |
|---|---|---|---|---|---|
| 1 Month Treasury | 3.72% | 3.68% | 1.1% | 4.34% | -14.3% |
| 2 Year Treasury | 3.98% | 3.92% | 1.5% | 3.92% | 1.5% |
| 10 Year Treasury | 4.45% | 4.42% | 0.7% | 4.43% | 0.5% |
| 30 Year Mortgage | 6.53% | 6.23% | 4.8% | 6.86% | -4.8% |
| US Corporate AAA | 4.99% | 4.94% | 1.0% | 4.88% | 2.3% |
| US Corporate BBB | 5.30% | 5.25% | 1.0% | 5.52% | -4.0% |
| US Corporate CCC | 13.42% | 13.00% | 3.2% | 12.86% | 4.4% |
| Effective Fed Funds | 3.62% | 3.64% | -0.5% | 4.33% | -16.4% |
| Indicator | Latest | 1 Mo Ago | 1 Mo % | 1 Yr Ago | 1 Yr % |
|---|---|---|---|---|---|
| Consumer Sentiment | 49.80 | 56.60 | -12.0% | 52.20 | -4.6% |
| Unemployment Rate | 4.30% | 4.40% | -2.3% | 4.20% | 2.4% |
| Inflation Rate (CPI YoY) | 3.80% | 2.40% | 58.3% | 2.30% | 65.2% |
| Manufacturing PMI | 52.70 | 52.40 | 0.6% | 48.70 | 8.2% |
| Non-Manufacturing PMI | 53.60 | 56.10 | -4.5% | 51.60 | 3.9% |
| Retail Sales ($M) | 656,115 | 641,038 | 2.4% | 623,635 | 5.2% |
| Building Permits (K) | 1,442 | 1,540 | -6.4% | 1,445 | -0.2% |
APP has been consolidating after a steep drawdown and is now breaking thru intermediate resistance. We believe a move back to old highs could be in the offing.
“...One of the things that we're seeing in food and sundries where we're really leaning in is kind of anything protein right now is doing extremely well. So protein snacks, protein bars, beef sticks. We launched our own Kirkland Signature Beef Stick that's doing tremendous volume and offering tremendous value to our members.”
©2020 YCharts, Inc. All Rights Reserved. YCharts, Inc. ("YCharts") is not registered with the U.S. Securities and Exchange Commission as an investment adviser, broker-dealer or in any other capacity, and does not purport to provide investment advice or make investment recommendations. This report has been generated through application of the analytical tools and data provided through ycharts.com and is intended solely to assist you or your investment or other adviser(s) in conducting investment research.
All data, statistics and charts are courtesy of YCharts unless otherwise noted. Investment Advice is offered through Fortis Capital Advisors, LLC, 7301 Mission Road, Suite 326, Prairie Village, KS 66208.
While reasonable efforts were used to obtain information from sources believed to be reliable, Fortis Capital Advisors, LLC makes no representation that the information or opinions contained in this material are accurate, reliable, or complete. All information and opinions are subject to change without notice. You should not construe this report as an offer to buy or sell, as a solicitation of an offer to buy or sell, or as a recommendation to buy, sell, hold or trade, any security or other financial instrument.
Past performance is not indicative of future results. Investing involves risk, including the possible loss of principal. The information contained herein is provided for informational purposes only and should not be construed as investment, tax, or legal advice. Recipients should consult their own advisers before making any investment decisions.
Source: Timber Point Capital Management. Powered by Fortis Capital Advisors. Investment Advice is offered through Fortis Capital Advisors, LLC, 7301 Mission Road, Suite 326, Prairie Village, KS 66208. All rights reserved.