
The Week That Was
U.S. equity indexes finished higher on improving sentiment around potential U.S.-Iran negotiations, strong AI-led earnings reports, and easing pressure from oil and long-term Treasury yields. The SPX rose 0.9%, extending its winning streak to eight weeks, while the DJIA advanced 2.1% to an all-time high, the Nasdaq gained 0.5%, and the R2K climbed 2.7%. Small-cap and value stocks outperformed, and the equal-weighted S&P 500 set a new high and outpaced the market-cap weighted index, suggesting healthier participation beneath the surface.
NVDA delivered another strong beat-and-raise quarter, reinforcing confidence in AI infrastructure demand. However retail earnings were more mixed, as WMT and TGT commentary raised questions about the durability of lower-income consumer spending. S&P Global's May flash PMI showed the composite output index holding at 51.7, with manufacturing rising to a four-year high of 55.3 while services slipped to 50.9. Input costs rose at the fastest pace since late 2022 and selling prices reached the highest level since August 2022.
Consumer sentiment weakened, with the University of Michigan index falling to a record low of 44.8, as year-ahead inflation expectations rose to 4.8% and long-run expectations increased to 3.9%. Housing data remained subdued as mortgage rates rose. Pending home sales increased 1.4% in April, and housing starts declined 2.8% to a 1.465M annual rate. Freddie Mac reported that the average 30-year mortgage rate rose to 6.51%, the highest level since August.
Treasury yields retraced with the 10-year ending at 4.56%, still higher by 40–60 basis points since the start of the Iran conflict. Commodities moved lower led by weakness in energy as geopolitical headlines tilted modestly toward de-escalation. WTI crude was down about 8.0%, approaching the $90 level (July). Precious metals declined on prospects for Fed tightening while industrial metals were firmer, led by copper. Agricultural commodities advanced as fertilizer shortages tied to supply disruptions tightened supply. The USD was little changed.
U.S. Equity Market Summary — As of 5/25/26
| Asset Class | 1 Wk | 1 Mo | 3 Mo | YTD | 1 Yr | 3 Yr | 5 Yr |
|---|---|---|---|---|---|---|---|
| S&P 500 | 0.91% | 4.81% | 8.49% | 9.69% | 29.50% | 22.91% | 14.09% |
| Dow Jones Industrials | 2.13% | 2.35% | 2.37% | 5.89% | 22.89% | 17.08% | 10.22% |
| NASDAQ | 0.45% | 6.91% | 15.31% | 13.62% | 40.06% | 28.36% | 15.20% |
| S&P MidCap 400 | 1.76% | 1.18% | 2.21% | 11.68% | 24.91% | 15.93% | 8.08% |
| Russell 2000 | 2.72% | 3.10% | 8.06% | 16.10% | 42.07% | 18.55% | 6.75% |
| Russell Micro Cap | 2.90% | 3.20% | 12.12% | 18.87% | 60.74% | 22.52% | 6.71% |
U.S. Sector Summary — As of 5/25/26
| Cyclical Sectors | 1 Wk | 1 Mo | 3 Mo | YTD | 1 Yr | 3 Yr | 5 Yr |
|---|---|---|---|---|---|---|---|
| Consumer Cyclical | 2.27% | 0.21% | 1.67% | 0.00% | 13.01% | 17.36% | 8.05% |
| Financials | 1.64% | -0.52% | -0.54% | -4.68% | 4.99% | 18.61% | 8.55% |
| Materials | -0.02% | -2.97% | -4.63% | 11.38% | 19.40% | 10.89% | 5.10% |
| Real Estate | 3.08% | 2.53% | 2.98% | 11.17% | 13.45% | 10.66% | 4.41% |
| Sensitive Sectors | 1 Wk | 1 Mo | 3 Mo | YTD | 1 Yr | 3 Yr | 5 Yr |
|---|---|---|---|---|---|---|---|
| Comm. Services | -0.53% | -2.05% | -0.83% | -1.61% | 16.13% | 24.40% | 9.58% |
| Energy | 0.08% | 5.22% | 9.10% | 33.92% | 50.26% | 18.25% | 22.34% |
| Industrials | 0.22% | 0.43% | -2.81% | 11.04% | 23.20% | 21.65% | 12.46% |
| Technology | 2.34% | 14.11% | 28.20% | 25.45% | 58.20% | 32.65% | 22.44% |
| Defensive Sectors | 1 Wk | 1 Mo | 3 Mo | YTD | 1 Yr | 3 Yr | 5 Yr |
|---|---|---|---|---|---|---|---|
| Consumer Defensive | 0.19% | 3.28% | -2.98% | 9.78% | 7.19% | 7.16% | 6.36% |
| Health Care | 3.30% | 2.40% | -4.03% | -2.77% | 16.86% | 6.23% | 5.49% |
| Utilities | 3.37% | 1.07% | -1.44% | 6.97% | 16.43% | 14.55% | 9.78% |
US Equity Style Summary — As of 5/25/26
| Equity Style | 1 Wk | 1 Mo | 3 Mo | YTD | 1 Yr | 3 Yr | 5 Yr |
|---|---|---|---|---|---|---|---|
| Large Growth | 0.18% | 5.45% | 13.11% | 7.81% | 29.19% | 26.89% | 15.32% |
| Large Blend | 0.92% | 4.80% | 8.66% | 9.29% | 29.09% | 23.12% | 13.71% |
| Large Value | 2.05% | 3.92% | 2.52% | 11.02% | 27.33% | 18.07% | 11.30% |
| Mid Growth | 2.08% | 2.82% | 5.77% | 4.59% | 10.49% | 15.51% | 6.63% |
| Mid Blend | 2.02% | 1.93% | 3.05% | 8.05% | 18.63% | 16.33% | 7.95% |
| Mid Value | 1.97% | 1.24% | 1.06% | 10.28% | 24.35% | 16.53% | 8.85% |
| Small Growth | 2.89% | 3.09% | 8.52% | 15.17% | 33.05% | 17.42% | 5.72% |
| Small Blend | 2.60% | 1.65% | 3.92% | 12.50% | 29.27% | 17.06% | 7.34% |
| Small Value | 2.37% | 0.56% | 0.57% | 10.50% | 26.42% | 16.75% | 8.40% |
International Equity Market Summary — As of 5/25/26
European markets gained on easing geopolitical tensions and stabilizing global yields. The STOXX Europe 600 rose 3.0%, led by Germany's DAX gain of 3.9%; followed by France's CAC 40 2.1% rise, Italy's FTSE MIB 0.8% advance and the FTSE 100 climb of 2.7%. The EC lowered its eurozone growth forecast to 0.9% for 2026 from a prior 1.2% estimate, citing the energy shock and volatile trade/geopolitical environment, while lifting its inflation forecast to 3.0%. The eurozone trade surplus narrowed sharply to EUR 7.8B from EUR 34.1B a year earlier, with exports to the U.S. down 38.8% y/y after tariffs introduced in 2025. German producer prices rose 1.7% y/y in April, the highest since May 2023, driven by intermediate goods and oil prices.
Japan's Nikkei 225 rose 3.1% and the TOPIX gained 0.7%. Technology and AI-related shares led after strong semiconductor earnings revived enthusiasm for the AI theme. The yen weakened to ~JPY 159.1 versus the USD after April core CPI slowed to 1.4% y/y, below the BoJ's 2% target for a third consecutive month. Still, the 10-year JGB yield rose to 2.76% from 2.72% as investors weighed medium-term inflation risks and fiscal concerns. First-quarter GDP grew at 2.1% y/y, ahead of expectations, helped by private consumption and net exports.
Chinese equities weakened on concerns about slowing growth as the CSI 300 declined 0.3% and the Shanghai Composite fell 0.5%. Industrial output slowed to 4.1% y/y from 5.7% while retail sales rose only 0.2% y/y and fixed asset investment contracted 1.6% for January through April. The PBOC left the one-year LPR at 3.0% and the five-year LPR at 3.5% for the 12th consecutive month. Investors focused on Vladimir Putin's May 19–20 visit to Beijing, where China and Russia signed agreements across trade, energy, technology, and media. Hong Kong's Hang Seng declined 1.4%.
| Region | 1 Wk | 1 Mo | 3 Mo | YTD | 1 Yr | 3 Yr | 5 Yr |
|---|---|---|---|---|---|---|---|
| MSCI ACWI | 1.81% | 4.51% | 6.00% | 11.07% | 31.05% | 22.41% | 11.84% |
| MSCI ACWI ex USA | 3.22% | 4.67% | 2.59% | 13.66% | 32.40% | 20.14% | 8.82% |
| MSCI Emerging Markets | 2.94% | 6.46% | 6.60% | 22.66% | 48.99% | 23.95% | 7.53% |
| MSCI Europe | 3.72% | 3.60% | -0.23% | 7.47% | 21.64% | 17.28% | 9.16% |
| MSCI Asia Pacific | 3.07% | 6.86% | 5.93% | 20.63% | 42.02% | 22.28% | 8.12% |
| MSCI Latin America | 0.93% | -4.81% | -5.79% | 14.39% | 42.64% | 16.54% | 11.26% |
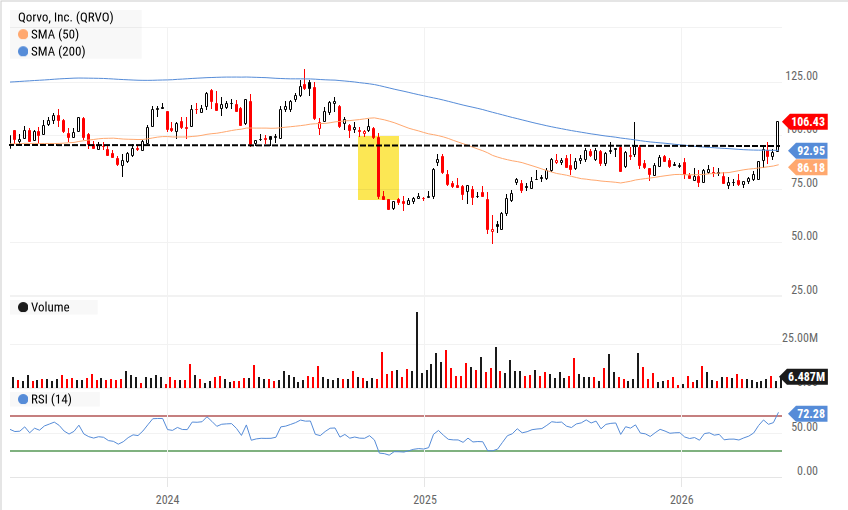
Chart of the Week — 5/25/26
QRVO has been building a base after a prolonged downtrend, with the stock showing early signs of a potential reversal. The RF semiconductor maker benefits from 5G infrastructure buildout and defense electronics demand. A break above near-term resistance on volume would confirm the setup. We like a small starter position with a tight stop below recent lows.
The Week Ahead
A holiday-shortened week ahead — Happy Memorial Day! — that is chock full of interesting earnings reports likely to continue to support AI momentum after NVDA CEO called out “parabolic” demand that is moving beyond the 5–7 hyperscalers to include AI-native and sovereign clouds, in addition to industrial, enterprise and physical AI buyers.
MRVL, DELL, NTNX, PSTG and NTAP are all infrastructure players looking to get their share of the hardware pie while software players (CRM, ADSK, SNOW, SNPS) will hope to allay investor fears that AI will eventually eat their “seats” and prodigious free cash flow.
Retail players including AZO, DKS, BBY, BURL, COST and GAP will have to find ways around escalating input costs as well as tighter consumer wallets. Last week, WMT called out higher fuel and agricultural costs (higher fertilizer prices) as impacting their margins.
The economic highlight of the week will be the PCE index (Thurs) which jumped to 3.5% in March, from prior 2.8%, and is expected to take a further step higher to 3.8% on higher energy costs. New Fed Chair Warsh will have his hands full as he attempts to navigate a rising price environment with scant movement in Iran negotiations.
Home prices (Tues) likely move marginally higher y/y, while new home sales continue to flatline since late '22.
| Company | Date | EPS Est. |
|---|---|---|
| AutoZone, Inc. (AZO) | Tue May 26 | $36.22 |
| Zscaler, Inc. (ZS) | Tue May 26 | $1.03 |
| Dick's Sporting Goods (DKS) | Wed May 27 | $3.90 |
| Agilent Technologies (A) | Wed May 27 | $1.50 |
| Salesforce, Inc. (CRM) | Wed May 27 | $3.25 |
| HP, Inc. (HPQ) | Wed May 27 | $0.64 |
| Marvell Technology (MRVL) | Wed May 27 | $0.90 |
| Snowflake, Inc. (SNOW) | Wed May 27 | $0.42 |
| Synopsys, Inc. (SNPS) | Wed May 27 | $3.63 |
| Best Buy Co., Inc. (BBY) | Thu May 28 | $1.32 |
| Autodesk, Inc. (ADSK) | Thu May 28 | $3.04 |
| Dell Technologies (DELL) | Thu May 28 | $3.02 |
| Gap, Inc. (GAP) | Thu May 28 | $0.52 |
| Data Release | Date | Est. |
|---|---|---|
| Chicago Fed National Activity Index | Tue May 26 | -0.30 |
| Case-Shiller Composite 20 HPI YoY | Tue May 26 | 1.1% |
| Conference Board Consumer Confidence | Wed May 27 | 92.0 |
| Richmond Fed Manufacturing Index | Wed May 27 | 4.00 |
| US Durable Goods New Orders MoM | Thu May 28 | 3.4% |
| US PCE Price Index YoY | Thu May 28 | 3.8% |
| US Personal Income MoM | Thu May 28 | 0.5% |
| US New Single Family Houses Sold | Thu May 28 | 660K |
| US Oil Rig Count | Fri May 29 | N/A |
| S&P Global Composite PMI Flash | Fri May 29 | 52.6 |
| US Index of Consumer Sentiment | Fri May 29 | 49.7 |
Key Interest Rates — As of 5/22/26
| Rate | As of | Latest | 1 Mo Ago | 1 Mo % | 1 Yr Ago | 1 Yr % |
|---|---|---|---|---|---|---|
| 1 Month Treasury | 5/22/26 | 3.72% | 3.68% | 1.1% | 4.37% | -14.9% |
| 2 Year Treasury | 5/22/26 | 4.13% | 3.79% | 9.0% | 4.00% | 3.3% |
| 10 Year Treasury | 5/22/26 | 4.56% | 4.30% | 6.0% | 4.54% | 0.4% |
| 30 Year Mortgage | 5/21/26 | 6.51% | 6.30% | 3.3% | 6.81% | -4.4% |
| US Corporate AAA | 5/21/26 | 5.08% | 4.89% | 3.9% | 4.95% | 2.6% |
| US Corporate BBB | 5/21/26 | 5.40% | 5.21% | 3.6% | 5.60% | -3.6% |
| US Corporate CCC | 5/21/26 | 13.55% | 12.99% | 4.3% | 13.00% | 4.2% |
| Effective Fed Funds | 5/21/26 | 3.62% | 3.64% | -0.5% | 4.33% | -16.4% |
US Economy Indicators
| Indicator | As of | Latest | 1 Mo Ago | 1 Mo % | 1 Yr Ago | 1 Yr % |
|---|---|---|---|---|---|---|
| Consumer Sentiment | 4/30/26 | 49.80 | 56.60 | -12.0% | 52.20 | -4.6% |
| Unemployment Rate | 4/30/26 | 4.30% | 4.40% | -2.3% | 4.20% | 2.4% |
| Inflation Rate (CPI YoY) | 4/30/26 | 3.80% | 2.40% | 58.3% | 2.30% | 65.2% |
| Manufacturing PMI | 4/30/26 | 52.70 | 52.40 | 0.6% | 48.70 | 8.2% |
| Non-Manufacturing PMI | 4/30/26 | 53.60 | 56.10 | -4.5% | 51.60 | 3.9% |
| Retail Sales ($M) | 4/30/26 | 656,115 | 641,038 | 2.4% | 623,635 | 5.2% |
| Building Permits (K) | 4/30/26 | 1,442 | 1,540 | -6.4% | 1,445 | -0.2% |
Suggested Readings
- 1Institute for the Study of War: Iran Update Special Report, May 24, 2026
- 2SpaceX IPO Filing Casts Starlink Mobile as Future Wireless Challenger
- 3A Model for Passive That Breaks the Market
- 4This 2.5GW Collaboration Aims to Advance the First 'Gas-Plus-Nuclear' Plant
- 5Buckle Up: Google is Set to Remake Search With Agentic AI in 2026
Leadership Insight
“The next wave of AI is physical AI — robots, autonomous vehicles, industrial systems. And the wave after that is agentic AI. Demand is parabolic. We are seeing it from hyperscalers, from sovereign clouds, from enterprises, from AI-native companies. Every single one of them is racing to build.”
Stocks to Watch
For our full list of Stocks To Watch, contact Patrick Mullin at pmullin@timberpointcapital.com
U.S. equity indexes finished higher on improving sentiment around potential U.S.-Iran negotiations, strong AI-led earnings reports, and easing pressure from oil and long-term Treasury yields. The SPX rose 0.9%, extending its winning streak to eight weeks, while the DJIA advanced 2.1% to an all-time high, the Nasdaq gained 0.5%, and the R2K climbed 2.7%. Small-cap and value stocks outperformed, and the equal-weighted S&P 500 set a new high.
NVDA delivered another strong beat-and-raise quarter, reinforcing confidence in AI infrastructure demand. Retail earnings were more mixed, as WMT and TGT commentary raised questions about the durability of lower-income consumer spending. S&P Global's May flash PMI showed the composite output index holding at 51.7, with manufacturing rising to a four-year high of 55.3 while services slipped to 50.9.
Consumer sentiment weakened, with the University of Michigan index falling to a record low of 44.8, as year-ahead inflation expectations rose to 4.8%. Housing data remained subdued as mortgage rates rose to 6.51%. Treasury yields retraced with the 10-year ending at 4.56%. WTI crude was down about 8.0% as geopolitical headlines tilted modestly toward de-escalation. The USD was little changed.
| Asset Class | 1 Wk | 1 Mo | 3 Mo | YTD | 1 Yr | 3 Yr | 5 Yr |
|---|---|---|---|---|---|---|---|
| S&P 500 | 0.91% | 4.81% | 8.49% | 9.69% | 29.50% | 22.91% | 14.09% |
| Dow Jones Industrials | 2.13% | 2.35% | 2.37% | 5.89% | 22.89% | 17.08% | 10.22% |
| NASDAQ | 0.45% | 6.91% | 15.31% | 13.62% | 40.06% | 28.36% | 15.20% |
| S&P MidCap 400 | 1.76% | 1.18% | 2.21% | 11.68% | 24.91% | 15.93% | 8.08% |
| Russell 2000 | 2.72% | 3.10% | 8.06% | 16.10% | 42.07% | 18.55% | 6.75% |
| Russell Micro Cap | 2.90% | 3.20% | 12.12% | 18.87% | 60.74% | 22.52% | 6.71% |
| Sector | 1Wk | YTD |
|---|---|---|
| 2.27% | 0.00% | |
| 1.64% | -4.68% | |
| -0.02% | 11.38% | |
| 3.08% | 11.17% |
| Sector | 1Wk | YTD |
|---|---|---|
| -0.53% | -1.61% | |
| 0.08% | 33.92% | |
| 0.22% | 11.04% | |
| 2.34% | 25.45% |
| Sector | 1Wk | YTD |
|---|---|---|
| 0.19% | 9.78% | |
| 3.30% | -2.77% | |
| 3.37% | 6.97% |
| Style | 1 Wk | 1 Mo | 3 Mo | YTD | 1 Yr | 3 Yr | 5 Yr |
|---|---|---|---|---|---|---|---|
| Large Growth | 0.18% | 5.45% | 13.11% | 7.81% | 29.19% | 26.89% | 15.32% |
| Large Blend | 0.92% | 4.80% | 8.66% | 9.29% | 29.09% | 23.12% | 13.71% |
| Large Value | 2.05% | 3.92% | 2.52% | 11.02% | 27.33% | 18.07% | 11.30% |
| Mid Growth | 2.08% | 2.82% | 5.77% | 4.59% | 10.49% | 15.51% | 6.63% |
| Mid Blend | 2.02% | 1.93% | 3.05% | 8.05% | 18.63% | 16.33% | 7.95% |
| Mid Value | 1.97% | 1.24% | 1.06% | 10.28% | 24.35% | 16.53% | 8.85% |
| Small Growth | 2.89% | 3.09% | 8.52% | 15.17% | 33.05% | 17.42% | 5.72% |
| Small Blend | 2.60% | 1.65% | 3.92% | 12.50% | 29.27% | 17.06% | 7.34% |
| Small Value | 2.37% | 0.56% | 0.57% | 10.50% | 26.42% | 16.75% | 8.40% |
A holiday-shortened week — Happy Memorial Day! — chock full of earnings likely to continue to support AI momentum after NVDA CEO called out “parabolic” demand moving beyond hyperscalers to include AI-native and sovereign clouds, industrial, enterprise and physical AI buyers.
MRVL, DELL, NTNX, PSTG and NTAP are infrastructure players looking to get their share of the hardware pie while software players (CRM, ADSK, SNOW, SNPS) will hope to allay investor fears that AI will eat their “seats” and free cash flow.
Retail players including AZO, DKS, BBY, BURL, COST and GAP will have to navigate escalating input costs and tighter consumer wallets. WMT called out higher fuel and agricultural costs as impacting margins.
The economic highlight is the PCE index (Thurs) expected to rise to 3.8% on higher energy costs. New Fed Chair Warsh navigates a rising price environment with scant movement in Iran negotiations.
| Company | Date | EPS Est. |
|---|---|---|
| AutoZone, Inc. (AZO) | Tue May 26 | $36.22 |
| Zscaler, Inc. (ZS) | Tue May 26 | $1.03 |
| Dick's Sporting Goods (DKS) | Wed May 27 | $3.90 |
| Agilent Technologies (A) | Wed May 27 | $1.50 |
| Salesforce, Inc. (CRM) | Wed May 27 | $3.25 |
| HP, Inc. (HPQ) | Wed May 27 | $0.64 |
| Marvell Technology (MRVL) | Wed May 27 | $0.90 |
| Snowflake, Inc. (SNOW) | Wed May 27 | $0.42 |
| Synopsys, Inc. (SNPS) | Wed May 27 | $3.63 |
| Best Buy Co., Inc. (BBY) | Thu May 28 | $1.32 |
| Autodesk, Inc. (ADSK) | Thu May 28 | $3.04 |
| Dell Technologies (DELL) | Thu May 28 | $3.02 |
| Gap, Inc. (GAP) | Thu May 28 | $0.52 |
| Data Release | Date | Est. |
|---|---|---|
| Chicago Fed National Activity Index | Tue May 26 | -0.30 |
| Case-Shiller Composite 20 HPI YoY | Tue May 26 | 1.1% |
| Conference Board Consumer Confidence | Wed May 27 | 92.0 |
| Richmond Fed Manufacturing Index | Wed May 27 | 4.00 |
| US Durable Goods New Orders MoM | Thu May 28 | 3.4% |
| US PCE Price Index YoY | Thu May 28 | 3.8% |
| US Personal Income MoM | Thu May 28 | 0.5% |
| US New Single Family Houses Sold | Thu May 28 | 660K |
| US Oil Rig Count | Fri May 29 | N/A |
| S&P Global Composite PMI Flash | Fri May 29 | 52.6 |
| US Index of Consumer Sentiment | Fri May 29 | 49.7 |
European markets gained on easing geopolitical tensions and stabilizing global yields. The STOXX Europe 600 rose 3.0%, led by Germany's DAX gain of 3.9%; followed by France's CAC 40 2.1% rise, Italy's FTSE MIB 0.8% advance and the FTSE 100 climb of 2.7%. The EC lowered its eurozone growth forecast to 0.9% for 2026 from a prior 1.2% estimate, citing the energy shock and volatile trade/geopolitical environment, while lifting its inflation forecast to 3.0%. The eurozone trade surplus narrowed sharply to EUR 7.8B from EUR 34.1B a year earlier, with exports to the U.S. down 38.8% y/y after tariffs introduced in 2025. German producer prices rose 1.7% y/y in April, the highest since May 2023.
Japan's Nikkei 225 rose 3.1% and the TOPIX gained 0.7%. Technology and AI-related shares led after strong semiconductor earnings revived enthusiasm for the AI theme. The yen weakened to ~JPY 159.1 versus the USD after April core CPI slowed to 1.4% y/y, below the BoJ's 2% target for a third consecutive month. The 10-year JGB yield rose to 2.76% from 2.72% as investors weighed medium-term inflation risks and fiscal concerns. First-quarter GDP grew at 2.1% y/y, ahead of expectations.
Chinese equities weakened on concerns about slowing growth as the CSI 300 declined 0.3% and the Shanghai Composite fell 0.5%. Industrial output slowed to 4.1% y/y from 5.7% while retail sales rose only 0.2% y/y and fixed asset investment contracted 1.6% for January through April. The PBOC left the one-year LPR at 3.0% and the five-year LPR at 3.5% for the 12th consecutive month. Investors focused on Putin's May 19–20 visit to Beijing. Hong Kong's Hang Seng declined 1.4%.
| Region | 1 Wk | 1 Mo | 3 Mo | YTD | 1 Yr | 3 Yr | 5 Yr |
|---|---|---|---|---|---|---|---|
| MSCI ACWI | 1.81% | 4.51% | 6.00% | 11.07% | 31.05% | 22.41% | 11.84% |
| MSCI ACWI ex USA | 3.22% | 4.67% | 2.59% | 13.66% | 32.40% | 20.14% | 8.82% |
| MSCI Emerging Markets | 2.94% | 6.46% | 6.60% | 22.66% | 48.99% | 23.95% | 7.53% |
| MSCI Europe | 3.72% | 3.60% | -0.23% | 7.47% | 21.64% | 17.28% | 9.16% |
| MSCI Asia Pacific | 3.07% | 6.86% | 5.93% | 20.63% | 42.02% | 22.28% | 8.12% |
| MSCI Latin America | 0.93% | -4.81% | -5.79% | 14.39% | 42.64% | 16.54% | 11.26% |
| Rate | Latest | 1 Mo Ago | 1 Mo % | 1 Yr Ago | 1 Yr % |
|---|---|---|---|---|---|
| 1 Month Treasury | 3.72% | 3.68% | 1.1% | 4.37% | -14.9% |
| 2 Year Treasury | 4.13% | 3.79% | 9.0% | 4.00% | 3.3% |
| 10 Year Treasury | 4.56% | 4.30% | 6.0% | 4.54% | 0.4% |
| 30 Year Mortgage | 6.51% | 6.30% | 3.3% | 6.81% | -4.4% |
| US Corporate AAA | 5.08% | 4.89% | 3.9% | 4.95% | 2.6% |
| US Corporate BBB | 5.40% | 5.21% | 3.6% | 5.60% | -3.6% |
| US Corporate CCC | 13.55% | 12.99% | 4.3% | 13.00% | 4.2% |
| Effective Fed Funds | 3.62% | 3.64% | -0.5% | 4.33% | -16.4% |
| Indicator | Latest | 1 Mo Ago | 1 Mo % | 1 Yr Ago | 1 Yr % |
|---|---|---|---|---|---|
| Consumer Sentiment | 49.80 | 56.60 | -12.0% | 52.20 | -4.6% |
| Unemployment Rate | 4.30% | 4.40% | -2.3% | 4.20% | 2.4% |
| Inflation Rate (CPI YoY) | 3.80% | 2.40% | 58.3% | 2.30% | 65.2% |
| Manufacturing PMI | 52.70 | 52.40 | 0.6% | 48.70 | 8.2% |
| Non-Manufacturing PMI | 53.60 | 56.10 | -4.5% | 51.60 | 3.9% |
| Retail Sales ($M) | 656,115 | 641,038 | 2.4% | 623,635 | 5.2% |
| Building Permits (K) | 1,442 | 1,540 | -6.4% | 1,445 | -0.2% |
QRVO has been building a base after a prolonged downtrend, with the stock showing early signs of a potential reversal. The RF semiconductor maker benefits from 5G infrastructure buildout and defense electronics demand. A break above near-term resistance on volume would confirm the setup. We like a small starter position with a tight stop below recent lows.
“The next wave of AI is physical AI — robots, autonomous vehicles, industrial systems. And the wave after that is agentic AI. Demand is parabolic. We are seeing it from hyperscalers, from sovereign clouds, from enterprises, from AI-native companies. Every single one of them is racing to build.”
©2020 YCharts, Inc. All Rights Reserved. YCharts, Inc. ("YCharts") is not registered with the U.S. Securities and Exchange Commission as an investment adviser, broker-dealer or in any other capacity, and does not purport to provide investment advice or make investment recommendations. This report has been generated through application of the analytical tools and data provided through ycharts.com and is intended solely to assist you or your investment or other adviser(s) in conducting investment research.
All data, statistics and charts are courtesy of YCharts unless otherwise noted. Investment Advice is offered through Fortis Capital Advisors, LLC, 7301 Mission Road, Suite 326, Prairie Village, KS 66208.
While reasonable efforts were used to obtain information from sources believed to be reliable, Fortis Capital Advisors, LLC makes no representation that the information or opinions contained in this material are accurate, reliable, or complete. All information and opinions are subject to change without notice. You should not construe this report as an offer to buy or sell, as a solicitation of an offer to buy or sell, or as a recommendation to buy, sell, hold or trade, any security or other financial instrument.
Past performance is not indicative of future results. Investing involves risk, including the possible loss of principal. The information contained herein is provided for informational purposes only and should not be construed as investment, tax, or legal advice. Recipients should consult their own advisers before making any investment decisions.
Source: Timber Point Capital Management. Powered by Fortis Capital Advisors. Investment Advice is offered through Fortis Capital Advisors, LLC, 7301 Mission Road, Suite 326, Prairie Village, KS 66208. All rights reserved.