
The Week That Was
Most major U.S. equity indexes finished slightly lower as hotter inflation data, rising Treasury yields, elevated oil prices, and lingering geopolitical uncertainty outweighed enthusiasm for AI-related stocks. The SPX still posted a modest 0.2% weekly gain and reached a record high on Thursday, while the Nasdaq and DJIA were roughly flat. Both the mid and small-caps were down a more meaningful 2.4% as yields moved higher.
Energy led all sectors with a 6.7% gain as crude prices surged, while AI enthusiasm supported large-cap technology through gains in CSCO and NVDA along with select software names such as PANW and CRWD, while memory names took a breather. Consumer discretionary remained under pressure, declining 3%, the worst performing sector.
Inflation data were the main macro pressure point. Headline CPI rose 0.6% m/m in April and 3.8% y/y, while core CPI increased 0.4% m/m and 2.8% y/y. PPI was hotter, rising 1.4% m/m and 4.4% y/y, the largest monthly increase since February 2023. Energy prices remained a major driver of the higher prices, reinforcing concerns that the Fed may need to keep policy restrictive for longer. Retail sales rose 0.5% m/m, ex-auto sales increased 0.7%, and control-group sales rose 0.5%, suggesting the consumer remains resilient despite higher gasoline prices — for the time being. Initial jobless claims rose to 211K, while continuing claims increased to 1.78M.
Fixed income yields moved higher as the 10-year Treasury yield rose to roughly 4.59%, while global rate pressure intensified as U.K. gilt yields reached multi-decade highs and Japan's long bond yield moved higher. WTI Crude settled above $105, up 10.4%, as the Trump-Xi summit produced no progress toward reopening the Strait of Hormuz. Gold and silver declined as a stronger USD and a more hawkish rate outlook weighed on precious metals, while copper held up better on AI-related investment demand. The USD strengthened 1.2%.
U.S. Equity Market Summary — As of 5/15/26
| Asset Class | 1 Wk | 1 Mo | 3 Mo | YTD | 1 Yr | 3 Yr | 5 Yr |
|---|---|---|---|---|---|---|---|
| S&P 500 | 0.17% | 5.57% | 8.70% | 8.70% | 26.75% | 23.12% | 13.80% |
| Dow Jones Industrials | -0.17% | 2.31% | 0.47% | 3.63% | 19.05% | 16.23% | 9.65% |
| NASDAQ | -0.08% | 9.25% | 16.51% | 13.07% | 38.06% | 29.39% | 15.16% |
| S&P MidCap 400 | -2.43% | 1.24% | 1.65% | 9.71% | 19.83% | 15.53% | 7.44% |
| Russell 2000 | -2.37% | 3.00% | 5.87% | 12.99% | 35.07% | 18.25% | 6.09% |
| Russell Micro Cap | -2.03% | 3.42% | 9.64% | 15.50% | 54.89% | 22.53% | 6.44% |
U.S. Sector Summary — As of 5/15/26
| Cyclical Sectors | 1 Wk | 1 Mo | 3 Mo | YTD | 1 Yr | 3 Yr | 5 Yr |
|---|---|---|---|---|---|---|---|
| Consumer Cyclical | -3.05% | -1.40% | 0.50% | -2.22% | 8.93% | 17.28% | 7.28% |
| Financials | -0.27% | -2.05% | -0.56% | -6.22% | 1.18% | 18.58% | 8.03% |
| Materials | -2.50% | -2.10% | -5.23% | 11.40% | 19.01% | 10.64% | 4.79% |
| Real Estate | -2.66% | -0.41% | 0.04% | 7.85% | 7.79% | 8.98% | 3.97% |
| Sensitive Sectors | 1 Wk | 1 Mo | 3 Mo | YTD | 1 Yr | 3 Yr | 5 Yr |
|---|---|---|---|---|---|---|---|
| Comm. Services | -0.74% | -1.09% | 1.63% | -1.08% | 16.25% | 25.97% | 9.63% |
| Energy | 6.71% | 6.60% | 10.07% | 33.80% | 43.33% | 18.41% | 21.71% |
| Industrials | -1.04% | 0.13% | -1.32% | 10.80% | 22.18% | 21.89% | 12.04% |
| Technology | 0.42% | 17.27% | 26.45% | 22.58% | 51.21% | 33.22% | 21.91% |
| Defensive Sectors | 1 Wk | 1 Mo | 3 Mo | YTD | 1 Yr | 3 Yr | 5 Yr |
|---|---|---|---|---|---|---|---|
| Consumer Defensive | 0.55% | 4.42% | -4.91% | 9.57% | 7.20% | 6.08% | 6.36% |
| Health Care | 1.12% | -1.81% | -7.59% | -5.88% | 13.20% | 4.94% | 4.96% |
| Utilities | -1.90% | -4.67% | -5.00% | 3.48% | 11.39% | 12.15% | 9.14% |
US Equity Style Summary — As of 5/15/26
| Equity Style | 1 Wk | 1 Mo | 3 Mo | YTD | 1 Yr | 3 Yr | 5 Yr |
|---|---|---|---|---|---|---|---|
| Large Growth | 0.62% | 7.99% | 14.65% | 7.61% | 27.52% | 27.93% | 15.31% |
| Large Blend | 0.22% | 5.58% | 8.80% | 8.29% | 26.40% | 23.33% | 13.44% |
| Large Value | -0.25% | 2.27% | 0.77% | 8.79% | 23.17% | 17.30% | 10.69% |
| Mid Growth | -1.12% | 2.61% | 4.64% | 2.47% | 7.00% | 15.22% | 6.44% |
| Mid Blend | -0.80% | 1.42% | 1.72% | 5.92% | 14.60% | 15.80% | 7.55% |
| Mid Value | -0.55% | 0.51% | -0.38% | 8.15% | 19.88% | 15.75% | 8.24% |
| Small Growth | -1.70% | 2.71% | 7.31% | 11.93% | 26.52% | 16.80% | 5.21% |
| Small Blend | -2.28% | 1.19% | 2.40% | 9.65% | 22.99% | 16.55% | 6.64% |
| Small Value | -2.72% | 0.03% | -1.14% | 7.94% | 20.33% | 16.33% | 7.58% |
International Equity Market Summary
All European equity markets declined with the STOXX Europe 600 down 0.9%. Germany's DAX declined 1.6%, Italy's FTSE MIB fell 0.4%, France's CAC 40 lost 2.0%, and the FTSE 100 shed 0.4% as U.S.-Iran peace talks stalled, raising concerns that higher energy prices could keep inflation and interest rates elevated. Eurozone industrial production rose 0.2% m/m in March, slightly below expectations, while French unemployment climbed to 8.1%, the highest level since early 2021. Germany's ZEW sentiment index improved to -10.2 but remained negative, with weak industrial production, higher energy prices, and inflation above 2% weighing on the outlook. U.K. retail sales fell 3.0% y/y, and political uncertainty added pressure to sterling and U.K. equities.
Japan was mixed, with the Nikkei 225 down 2.1% and the TOPIX up 0.9%. Semiconductor and AI-related shares saw profit taking while financials and value-oriented sectors benefited from higher domestic yields and expectations that the BoJ will continue normalizing policy. The yen weakened to the JPY 158 range versus the USD, as intervention gains from late April proved temporary and investors refocused on the policy gap between the Fed and BoJ. The 10-year JGB yield rose to 2.72% from 2.48%, its highest level since 1997, as investors increasingly priced the possibility of a BoJ hike. Japan's corporate goods price index rose 4.9% y/y in April, ahead of expectations, while household spending fell 2.9% y/y.
Chinese equities ended lower as early optimism around the Trump-Xi summit and better macro data faded. The CSI 300 slipped 0.3% and the Shanghai Composite declined 1.1%. Services activity remained resilient, with the RatingDog China General Services PMI rising to 52.6 and the composite output index increasing to 53.1, although export orders fell for a second consecutive month. Inflation and trade data were firmer, with PPI up 2.8% y/y, CPI up 1.2% y/y, exports up 14.1% y/y, and imports up 25.3% y/y — all reducing pressure for broad-based monetary easing. Hong Kong's Hang Seng declined 1.6%.
| Region | 1 Wk | 1 Mo | 3 Mo | YTD | 1 Yr | 3 Yr | 5 Yr |
|---|---|---|---|---|---|---|---|
| MSCI ACWI | -0.60% | 3.82% | 6.04% | 9.10% | 27.62% | 21.37% | 11.72% |
| MSCI ACWI ex USA | -1.81% | 0.99% | 1.60% | 10.13% | 29.54% | 17.86% | 8.60% |
| MSCI Emerging Markets | -2.45% | 5.53% | 7.85% | 19.51% | 44.99% | 22.35% | 7.59% |
| MSCI Europe | -1.81% | -2.40% | -2.27% | 2.89% | 17.98% | 14.31% | 8.56% |
| MSCI Asia Pacific | -1.66% | 5.34% | 5.64% | 17.79% | 39.73% | 20.69% | 8.24% |
| MSCI Latin America | -5.71% | -9.42% | -4.92% | 12.36% | 38.74% | 14.97% | 10.44% |
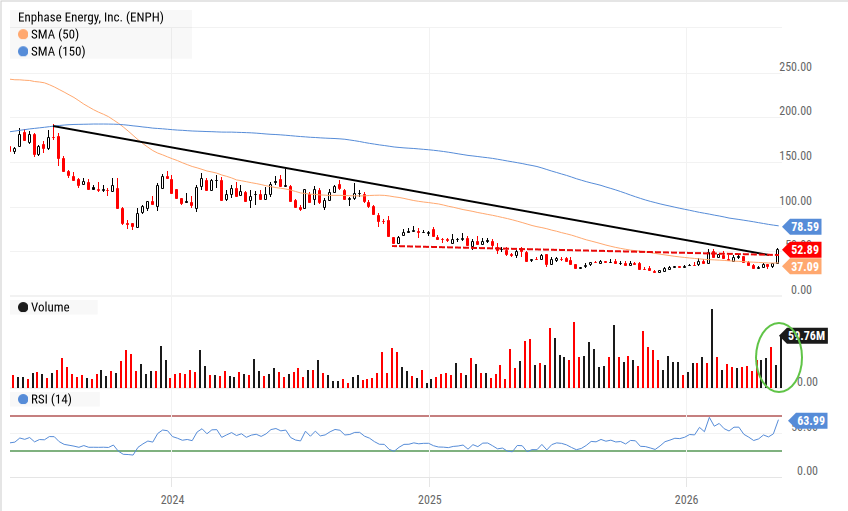
Chart of the Week — 5/18/26
ENPH had a strong week on elevated volume. The stock has the makings of a bear to bull reversal as a downtrend back to mid '23 is being challenged as is an intermediate resistance line in the low $50's range. We like a small position and growing larger as resistance becomes support.
The Week Ahead
NVDA (Wed) will put a cherry on top of technology earnings as they are expected to post F1Q27 (April) revenue and EPS growth of 80% ($79.1B) and 120% ($1.78), and will likely solidify recent commentary that compute capacity is tight and will remain tight for the near future. We will be listening for insight on future hyperscaler capex as well as any supply constraints that may act as a governor on growth. At less than 30x F27 EPS and a PEG ratio of sub 0.5x, we find the shares attractive even after the recent run to new highs.
Retail EPS are in focus as HD, LOW, TGT, TJX, and WSM all report with different dynamics in play and investors concerned that paychecks are increasingly being stretched by higher gasoline prices as well as incipient inflation that was laid bare in last week's CPI and PPI reports.
Wednesday's FOMC minutes will tell a tale of two Fed's, with more Governors pushing for neutral to hawkish language — which will be at odds with new Chairman Warsh's beliefs that AI will be disinflationary and that government reporting mechanisms need a makeover.
A slew of housing data — NAHB, pending home sales, building permits, and housing starts — are unlikely to jump start investor sentiment though upticks in permits (Feb) and starts (Mar) offer some hope that the bottom has been set. S&P Global Composite Flash estimates (Thur) will show the US economy remains in expansion territory (>50.0).
| Company | Date | EPS Est. |
|---|---|---|
| Amer Sports, Inc. (AS) | Tue May 19 | $0.07 |
| The Home Depot, Inc. (HD) | Tue May 19 | $4.74 |
| Cava Group, Inc. (CAVA) | Tue May 19 | $0.17 |
| Toll Brothers, Inc. (TOL) | Tue May 19 | $3.42 |
| Analog Devices, Inc. (ADI) | Wed May 20 | $3.01 |
| Lowe's Companies, Inc. (LOW) | Wed May 20 | $4.42 |
| Target Corp. (TGT) | Wed May 20 | $2.24 |
| The TJX Cos., Inc. (TJX) | Wed May 20 | $1.18 |
| Williams-Sonoma, Inc. (WSM) | Wed May 20 | $2.04 |
| NVIDIA Corp. (NVDA) | Wed May 20 | $1.96 |
| Deere & Co. (DE) | Thu May 21 | $5.09 |
| Walmart, Inc. (WMT) | Thu May 21 | $0.75 |
| Data Release | Date | Est. |
|---|---|---|
| NAHB/Wells Fargo Housing Market Index | Mon May 18 | 35.0 |
| US Pending Home Sales YoY | Tue May 19 | -0.5% |
| FOMC Minutes | Wed May 20 | N/A |
| US Building Permits | Thu May 21 | 1.37M |
| US Housing Starts | Thu May 21 | 1.45M |
| Philly Fed Manufacturing Activity Index | Thu May 21 | 19.0 |
| S&P Global Composite PMI Flash | Thu May 21 | 51.5 |
| Kansas City Fed Manufacturing Activity | Thu May 21 | -4 |
| US Oil Rig Count | Fri May 22 | N/A |
| US Index of Consumer Sentiment | Fri May 22 | 48.2 |
Key Interest Rates — As of 5/15/26
| Rate | As of | Latest | 1 Mo Ago | 1 Mo % | 1 Yr Ago | 1 Yr % |
|---|---|---|---|---|---|---|
| 1 Month Treasury | 5/15/26 | 3.71% | 3.72% | -0.3% | 4.37% | -15.1% |
| 2 Year Treasury | 5/15/26 | 4.09% | 3.76% | 8.8% | 3.96% | 3.3% |
| 10 Year Treasury | 5/15/26 | 4.59% | 4.29% | 7.0% | 4.45% | 3.1% |
| 30 Year Mortgage | 5/14/26 | 6.36% | 6.37% | -0.2% | 6.76% | -5.9% |
| US Corporate AAA | 5/14/26 | 5.03% | 4.82% | 4.4% | 4.92% | 2.2% |
| US Corporate BBB | 5/14/26 | 5.34% | 5.17% | 3.3% | 5.61% | -4.8% |
| US Corporate CCC | 5/14/26 | 13.31% | 13.13% | 1.4% | 12.75% | 4.4% |
| Effective Fed Funds | 5/14/26 | 3.63% | 3.64% | -0.3% | 4.33% | -16.2% |
US Economy Indicators
| Indicator | As of | Latest | 1 Mo Ago | 1 Mo % | 1 Yr Ago | 1 Yr % |
|---|---|---|---|---|---|---|
| Consumer Sentiment | 4/30/26 | 49.80 | 56.60 | -12.0% | 52.20 | -4.6% |
| Unemployment Rate | 4/30/26 | 4.30% | 4.40% | -2.3% | 4.20% | 2.4% |
| Inflation Rate (CPI YoY) | 4/30/26 | 3.80% | 2.40% | 58.3% | 2.30% | 65.2% |
| Manufacturing PMI | 4/30/26 | 52.70 | 52.40 | 0.6% | 48.70 | 8.2% |
| Non-Manufacturing PMI | 4/30/26 | 53.60 | 56.10 | -4.5% | 51.60 | 3.9% |
| Retail Sales ($M) | 4/30/26 | 656,115 | 641,038 | 2.4% | 623,635 | 5.2% |
| Building Permits (K) | 3/31/26 | 1,372 | 1,538 | -10.8% | 1,481 | -7.4% |
Suggested Readings
- 1Institute for the Study of War: Iran Update Special Report, May 17, 2026
- 2Cerebras IPO Makes Billions For Benchmark but VC Vishria Almost Didn't Take the Meeting
- 3Why Kevin Warsh Won't Revolutionize the Fed
- 4FDA Blocked Melanoma Drug as Confusion Reigned Under Makary
- 5Beyond Taiwan, a "Decent Peace" at the Trump-Xi Summit
Leadership Insight
“And just with regard to the restructuring, this was really not a savings-driven restructure. It’s really — things are moving incredibly fast right now. And this is more realigning from an already strong base, as you’re seeing in our financials, but really realigning resources around silicon, optics, security and AI…and so that’s really what this is about versus savings.”
Stocks to Consider
For our full list of Stocks To Consider, contact Patrick Mullin at pmullin@timberpointcapital.com
Most major U.S. equity indexes finished slightly lower as hotter inflation data, rising Treasury yields, elevated oil prices, and lingering geopolitical uncertainty outweighed enthusiasm for AI-related stocks. The SPX still posted a modest 0.2% weekly gain and reached a record high on Thursday, while the Nasdaq and DJIA were roughly flat. Both the mid and small-caps were down a more meaningful 2.4% as yields moved higher.
Energy led all sectors with a 6.7% gain as crude prices surged, while AI enthusiasm supported large-cap technology through gains in CSCO and NVDA along with select software names such as PANW and CRWD, while memory names took a breather. Consumer discretionary remained under pressure, declining 3%, the worst performing sector.
Inflation data were the main macro pressure point. Headline CPI rose 0.6% m/m in April and 3.8% y/y, while core CPI increased 0.4% m/m and 2.8% y/y. PPI was hotter, rising 1.4% m/m and 4.4% y/y, the largest monthly increase since February 2023. Retail sales rose 0.5% m/m, suggesting the consumer remains resilient despite higher gasoline prices. Initial jobless claims rose to 211K, while continuing claims increased to 1.78M.
Fixed income yields moved higher as the 10-year Treasury yield rose to roughly 4.59%, while global rate pressure intensified as U.K. gilt yields reached multi-decade highs and Japan's long bond yield moved higher. WTI Crude settled above $105, up 10.4%, as the Trump-Xi summit produced no progress toward reopening the Strait of Hormuz.
| Asset Class | 1 Wk | 1 Mo | 3 Mo | YTD | 1 Yr | 3 Yr | 5 Yr |
|---|---|---|---|---|---|---|---|
| S&P 500 | 0.17% | 5.57% | 8.70% | 8.70% | 26.75% | 23.12% | 13.80% |
| Dow Jones Industrials | -0.17% | 2.31% | 0.47% | 3.63% | 19.05% | 16.23% | 9.65% |
| NASDAQ | -0.08% | 9.25% | 16.51% | 13.07% | 38.06% | 29.39% | 15.16% |
| S&P MidCap 400 | -2.43% | 1.24% | 1.65% | 9.71% | 19.83% | 15.53% | 7.44% |
| Russell 2000 | -2.37% | 3.00% | 5.87% | 12.99% | 35.07% | 18.25% | 6.09% |
| Russell Micro Cap | -2.03% | 3.42% | 9.64% | 15.50% | 54.89% | 22.53% | 6.44% |
| Sector | 1Wk | YTD |
|---|---|---|
| -3.05% | -2.22% | |
| -0.27% | -6.22% | |
| -2.50% | 11.40% | |
| -2.66% | 7.85% |
| Sector | 1Wk | YTD |
|---|---|---|
| -0.74% | -1.08% | |
| 6.71% | 33.80% | |
| -1.04% | 10.80% | |
| 0.42% | 22.58% |
| Sector | 1Wk | YTD |
|---|---|---|
| 0.55% | 9.57% | |
| 1.12% | -5.88% | |
| -1.90% | 3.48% |
| Style | 1 Wk | 1 Mo | 3 Mo | YTD | 1 Yr | 3 Yr | 5 Yr |
|---|---|---|---|---|---|---|---|
| Large Growth | 0.62% | 7.99% | 14.65% | 7.61% | 27.52% | 27.93% | 15.31% |
| Large Blend | 0.22% | 5.58% | 8.80% | 8.29% | 26.40% | 23.33% | 13.44% |
| Large Value | -0.25% | 2.27% | 0.77% | 8.79% | 23.17% | 17.30% | 10.69% |
| Mid Growth | -1.12% | 2.61% | 4.64% | 2.47% | 7.00% | 15.22% | 6.44% |
| Mid Blend | -0.80% | 1.42% | 1.72% | 5.92% | 14.60% | 15.80% | 7.55% |
| Mid Value | -0.55% | 0.51% | -0.38% | 8.15% | 19.88% | 15.75% | 8.24% |
| Small Growth | -1.70% | 2.71% | 7.31% | 11.93% | 26.52% | 16.80% | 5.21% |
| Small Blend | -2.28% | 1.19% | 2.40% | 9.65% | 22.99% | 16.55% | 6.64% |
| Small Value | -2.72% | 0.03% | -1.14% | 7.94% | 20.33% | 16.33% | 7.58% |
NVDA (Wed) will put a cherry on top of technology earnings as they are expected to post F1Q27 (April) revenue and EPS growth of 80% ($79.1B) and 120% ($1.78), and will likely solidify recent commentary that compute capacity is tight and will remain tight for the near future. At less than 30x F27 EPS and a PEG ratio of sub 0.5x, we find the shares attractive even after the recent run to new highs.
Retail EPS are in focus as HD, LOW, TGT, TJX, and WSM all report with different dynamics in play and investors concerned that paychecks are increasingly being stretched by higher gasoline prices as well as incipient inflation that was laid bare in last week's CPI and PPI reports.
Wednesday's FOMC minutes will tell a tale of two Fed's, with more Governors pushing for neutral to hawkish language — which will be at odds with new Chairman Warsh's beliefs that AI will be disinflationary and that government reporting mechanisms need a makeover.
A slew of housing data — NAHB, pending home sales, building permits, and housing starts — are unlikely to jump start investor sentiment. S&P Global Composite Flash estimates (Thur) will show the US economy remains in expansion territory (>50.0).
| Company | Date | EPS Est. |
|---|---|---|
| Amer Sports, Inc. (AS) | Tue May 19 | $0.07 |
| The Home Depot, Inc. (HD) | Tue May 19 | $4.74 |
| Cava Group, Inc. (CAVA) | Tue May 19 | $0.17 |
| Toll Brothers, Inc. (TOL) | Tue May 19 | $3.42 |
| Analog Devices, Inc. (ADI) | Wed May 20 | $3.01 |
| Lowe's Companies, Inc. (LOW) | Wed May 20 | $4.42 |
| Target Corp. (TGT) | Wed May 20 | $2.24 |
| The TJX Cos., Inc. (TJX) | Wed May 20 | $1.18 |
| Williams-Sonoma, Inc. (WSM) | Wed May 20 | $2.04 |
| NVIDIA Corp. (NVDA) | Wed May 20 | $1.96 |
| Deere & Co. (DE) | Thu May 21 | $5.09 |
| Walmart, Inc. (WMT) | Thu May 21 | $0.75 |
| Data Release | Date | Est. |
|---|---|---|
| NAHB/Wells Fargo Housing Market Index | Mon May 18 | 35.0 |
| US Pending Home Sales YoY | Tue May 19 | -0.5% |
| FOMC Minutes | Wed May 20 | N/A |
| US Building Permits | Thu May 21 | 1.37M |
| US Housing Starts | Thu May 21 | 1.45M |
| Philly Fed Manufacturing Activity Index | Thu May 21 | 19.0 |
| S&P Global Composite PMI Flash | Thu May 21 | 51.5 |
| Kansas City Fed Manufacturing Activity | Thu May 21 | -4 |
| US Oil Rig Count | Fri May 22 | N/A |
| US Index of Consumer Sentiment | Fri May 22 | 48.2 |
All European equity markets declined with the STOXX Europe 600 down 0.9%. Germany's DAX declined 1.6%, Italy's FTSE MIB fell 0.4%, France's CAC 40 lost 2.0%, and the FTSE 100 shed 0.4% as U.S.-Iran peace talks stalled, raising concerns that higher energy prices could keep inflation and interest rates elevated. Eurozone industrial production rose 0.2% m/m in March, slightly below expectations, while French unemployment climbed to 8.1%, the highest level since early 2021. Germany's ZEW sentiment index improved to -10.2 but remained negative, with weak industrial production, higher energy prices, and inflation above 2% weighing on the outlook. U.K. retail sales fell 3.0% y/y, and political uncertainty added pressure to sterling and U.K. equities.
Japan was mixed, with the Nikkei 225 down 2.1% and the TOPIX up 0.9%. Semiconductor and AI-related shares saw profit taking while financials and value-oriented sectors benefited from higher domestic yields and expectations that the BoJ will continue normalizing policy. The yen weakened to the JPY 158 range versus the USD, as intervention gains from late April proved temporary and investors refocused on the policy gap between the Fed and BoJ. The 10-year JGB yield rose to 2.72% from 2.48%, its highest level since 1997, as investors increasingly priced the possibility of a BoJ hike. Japan's corporate goods price index rose 4.9% y/y in April, ahead of expectations, while household spending fell 2.9% y/y.
Chinese equities ended lower as early optimism around the Trump-Xi summit and better macro data faded. The CSI 300 slipped 0.3% and the Shanghai Composite declined 1.1%. Services activity remained resilient, with the RatingDog China General Services PMI rising to 52.6 and the composite output index increasing to 53.1, although export orders fell for a second consecutive month. Inflation and trade data were firmer, with PPI up 2.8% y/y, CPI up 1.2% y/y, exports up 14.1% y/y, and imports up 25.3% y/y — all reducing pressure for broad-based monetary easing. Hong Kong's Hang Seng declined 1.6%.
| Region | 1 Wk | 1 Mo | 3 Mo | YTD | 1 Yr | 3 Yr | 5 Yr |
|---|---|---|---|---|---|---|---|
| MSCI ACWI | -0.60% | 3.82% | 6.04% | 9.10% | 27.62% | 21.37% | 11.72% |
| MSCI ACWI ex USA | -1.81% | 0.99% | 1.60% | 10.13% | 29.54% | 17.86% | 8.60% |
| MSCI Emerging Markets | -2.45% | 5.53% | 7.85% | 19.51% | 44.99% | 22.35% | 7.59% |
| MSCI Europe | -1.81% | -2.40% | -2.27% | 2.89% | 17.98% | 14.31% | 8.56% |
| MSCI Asia Pacific | -1.66% | 5.34% | 5.64% | 17.79% | 39.73% | 20.69% | 8.24% |
| MSCI Latin America | -5.71% | -9.42% | -4.92% | 12.36% | 38.74% | 14.97% | 10.44% |
| Rate | Latest | 1 Mo Ago | 1 Mo % | 1 Yr Ago | 1 Yr % |
|---|---|---|---|---|---|
| 1 Month Treasury | 3.71% | 3.72% | -0.3% | 4.37% | -15.1% |
| 2 Year Treasury | 4.09% | 3.76% | 8.8% | 3.96% | 3.3% |
| 10 Year Treasury | 4.59% | 4.29% | 7.0% | 4.45% | 3.1% |
| 30 Year Mortgage | 6.36% | 6.37% | -0.2% | 6.76% | -5.9% |
| US Corporate AAA | 5.03% | 4.82% | 4.4% | 4.92% | 2.2% |
| US Corporate BBB | 5.34% | 5.17% | 3.3% | 5.61% | -4.8% |
| US Corporate CCC | 13.31% | 13.13% | 1.4% | 12.75% | 4.4% |
| Effective Fed Funds | 3.63% | 3.64% | -0.3% | 4.33% | -16.2% |
| Indicator | Latest | 1 Mo Ago | 1 Mo % | 1 Yr Ago | 1 Yr % |
|---|---|---|---|---|---|
| Consumer Sentiment | 49.80 | 56.60 | -12.0% | 52.20 | -4.6% |
| Unemployment Rate | 4.30% | 4.40% | -2.3% | 4.20% | 2.4% |
| Inflation Rate (CPI YoY) | 3.80% | 2.40% | 58.3% | 2.30% | 65.2% |
| Manufacturing PMI | 52.70 | 52.40 | 0.6% | 48.70 | 8.2% |
| Non-Manufacturing PMI | 53.60 | 56.10 | -4.5% | 51.60 | 3.9% |
| Retail Sales ($M) | 656,115 | 641,038 | 2.4% | 623,635 | 5.2% |
| Building Permits (K) | 1,372 | 1,538 | -10.8% | 1,481 | -7.4% |
ENPH had a strong week on elevated volume. The stock has the makings of a bear to bull reversal as a downtrend back to mid '23 is being challenged as is an intermediate resistance line in the low $50's range. We like a small position and growing larger as resistance becomes support.
“And just with regard to the restructuring, this was really not a savings-driven restructure. It’s really — things are moving incredibly fast right now. And this is more realigning from an already strong base, as you’re seeing in our financials, but really realigning resources around silicon, optics, security and AI…and so that’s really what this is about versus savings.”
©2020 YCharts, Inc. All Rights Reserved. YCharts, Inc. ("YCharts") is not registered with the U.S. Securities and Exchange Commission as an investment adviser, broker-dealer or in any other capacity, and does not purport to provide investment advice or make investment recommendations. This report has been generated through application of the analytical tools and data provided through ycharts.com and is intended solely to assist you or your investment or other adviser(s) in conducting investment research.
All data, statistics and charts are courtesy of YCharts unless otherwise noted. Investment Advice is offered through Fortis Capital Advisors, LLC, 7301 Mission Road, Suite 326, Prairie Village, KS 66208.
While reasonable efforts were used to obtain information from sources believed to be reliable, Fortis Capital Advisors, LLC makes no representation that the information or opinions contained in this material are accurate, reliable, or complete. All information and opinions are subject to change without notice. You should not construe this report as an offer to buy or sell, as a solicitation of an offer to buy or sell, or as a recommendation to buy, sell, hold or trade, any security or other financial instrument.
Past performance is not indicative of future results. Investing involves risk, including the possible loss of principal. The information contained herein is provided for informational purposes only and should not be construed as investment, tax, or legal advice. Recipients should consult their own advisers before making any investment decisions.
Source: Timber Point Capital Management. Powered by Fortis Capital Advisors. Investment Advice is offered through Fortis Capital Advisors, LLC, 7301 Mission Road, Suite 326, Prairie Village, KS 66208. All rights reserved.