
The Week That Was
U.S. equities advanced as investors looked past geopolitical volatility and focused on strong earnings, resilient labor data, and continued AI-related momentum. All major indexes were in the green led by the Nasdaq which gained 4.5% spurred on by an 8.4% rise in the technology sector (XLK). The SPX climbed by 2.4% to record highs, while small and mid-cap indexes climbed by 1.7%, also closing at new highs during the week.
Corporate earnings remained strong, with roughly 85% of S&P 500 companies having reported and just under 85% beating consensus estimates (Factset). The technology sector (XLK) was driven by memory names including MU and SNDK, which both gained in excess of 30%, while AMD and INTC posted mid-20% gains as investors sought CPU exposure as their importance to inference tech stacks became more clear. The Energy sector (XLE) was the big loser, down 5.4%, on renewed hopes for fruitful negotiations in the Middle East.
Labor market data were generally firm as initial jobless claims rose to 200K, still below expectations, while continuing claims slipped to 1.77M, the lowest level since 2024. Nonfarm payrolls increased by 115K in April, ahead of estimates, and March payrolls were revised higher to 185K. The unemployment rate held at 4.3%, although labor force participation fell to its lowest level since October 2021. Layoff announcements rose sequentially in April, with technology companies accounting for the largest share, often citing AI-related reductions.
Construction spending rebounded in March, factory orders rose more than expected, and demand for electronic products remained tied to the build-out of AI infrastructure. Despite the above, consumer sentiment fell to a record low in early May. Treasury yields declined slightly, the 10-year finished at 4.36%, amid lower oil prices and the Treasury Department's quarterly refunding announcement which showed steady borrowing needs.
Oil markets were focused on the SoH and brief clashes between U.S. and Iranian forces, but WTI crude ended lower amid Washington's latest peace proposal. Gold was higher supported by safe-haven demand and China's largest reported monthly purchase in more than a year. Silver and copper advanced, and the USD weakened slightly. The yen was stronger amid signs of potential intervention.
U.S. Equity Market Summary — As of 5/8/26
| Asset Class | 1 Wk | 1 Mo | 3 Mo | YTD | 1 Yr | 3 Yr | 5 Yr |
|---|---|---|---|---|---|---|---|
| S&P 500 | 2.36% | 9.16% | 7.06% | 8.52% | 32.27% | 23.06% | 13.45% |
| Dow Jones Industrials | 0.22% | 3.62% | -0.58% | 3.75% | 21.99% | 15.99% | 9.43% |
| NASDAQ | 4.51% | 15.99% | 14.15% | 13.14% | 47.33% | 29.81% | 14.64% |
| S&P MidCap 400 | 1.65% | 9.01% | 4.34% | 13.32% | 30.24% | 16.65% | 8.01% |
| Russell 2000 | 1.72% | 9.23% | 7.48% | 15.70% | 43.03% | 19.36% | 6.16% |
| Russell Micro Cap | 1.97% | 10.30% | 10.01% | 17.85% | 64.13% | 23.72% | 6.35% |
U.S. Sector Summary — As of 5/8/26
| Cyclical Sectors | 1 Wk | 1 Mo | 3 Mo | YTD | 1 Yr | 3 Yr | 5 Yr |
|---|---|---|---|---|---|---|---|
| Consumer Cyclical | 1.32% | 8.46% | 2.07% | 0.86% | 20.27% | 18.59% | 7.10% |
| Financials | -1.31% | 0.08% | -5.08% | -5.97% | 4.34% | 18.42% | 8.14% |
| Materials | 0.47% | -0.31% | 0.59% | 14.26% | 24.71% | 11.28% | 5.34% |
| Real Estate | 0.20% | 4.64% | 6.47% | 10.80% | 11.08% | 9.80% | 4.32% |
| Sensitive Sectors | 1 Wk | 1 Mo | 3 Mo | YTD | 1 Yr | 3 Yr | 5 Yr |
|---|---|---|---|---|---|---|---|
| Comm. Services | 0.19% | 2.75% | 1.34% | -0.35% | 21.19% | 27.04% | 9.46% |
| Energy | -5.35% | -4.05% | 5.28% | 25.39% | 40.89% | 15.24% | 20.07% |
| Industrials | 0.14% | 1.62% | 0.29% | 11.97% | 29.05% | 22.24% | 12.14% |
| Technology | 8.43% | 23.88% | 24.52% | 22.06% | 62.03% | 33.34% | 21.27% |
| Defensive Sectors | 1 Wk | 1 Mo | 3 Mo | YTD | 1 Yr | 3 Yr | 5 Yr |
|---|---|---|---|---|---|---|---|
| Consumer Defensive | 0.01% | 1.69% | -3.74% | 8.97% | 6.30% | 5.88% | 6.32% |
| Health Care | -1.15% | -4.13% | -8.64% | -6.93% | 8.87% | 4.20% | 4.62% |
| Utilities | -3.93% | -4.40% | 3.87% | 5.48% | 14.81% | 12.51% | 9.51% |
US Equity Style Summary — As of 5/8/26
| Equity Style | 1 Wk | 1 Mo | 3 Mo | YTD | 1 Yr | 3 Yr | 5 Yr |
|---|---|---|---|---|---|---|---|
| Large Growth | 3.58% | 14.09% | 11.33% | 6.96% | 35.04% | 27.98% | 14.63% |
| Large Blend | 2.31% | 9.20% | 7.04% | 8.05% | 31.84% | 23.27% | 13.08% |
| Large Value | 0.58% | 2.55% | 0.90% | 9.06% | 25.76% | 17.13% | 10.68% |
| Mid Growth | 1.16% | 6.50% | 5.51% | 3.62% | 13.33% | 16.03% | 6.27% |
| Mid Blend | -0.09% | 3.43% | 2.87% | 6.77% | 19.37% | 16.12% | 7.43% |
| Mid Value | -1.03% | 1.16% | 0.91% | 8.75% | 23.24% | 15.64% | 8.19% |
| Small Growth | 1.78% | 8.22% | 8.54% | 13.87% | 34.00% | 17.81% | 4.95% |
| Small Blend | 1.24% | 5.66% | 4.32% | 12.21% | 30.81% | 17.60% | 6.73% |
| Small Value | 0.82% | 3.77% | 1.28% | 10.96% | 28.42% | 17.40% | 7.91% |
International Equity Market Summary
In Europe, the STOXX Europe 600 finished with modest gains, while Germany's DAX rose 0.2%, Italy's FTSE MIB gained 2.2%, France's CAC 40 was little changed, and the UK's FTSE 100 fell 1.3%. Sentiment improved early in the week on better Middle East headlines and solid corporate earnings but weakened later after President Trump threatened higher tariffs on the EU if the bloc did not reduce tariffs on U.S. goods to zero. Economic data were mixed as ECB officials signaled the possibility of a June rate increase. Eurozone producer prices rose at the fastest monthly pace since 2022, German factory orders jumped 5.0%, and the UK Composite PMI rose to 52.6.
Japanese markets rallied during a holiday-shortened week as the Nikkei 225 surged 5.4% to a record high, while the TOPIX gained 2.7%, led by technology and semiconductor shares and AI demand optimism. Falling oil prices helped ease concerns about Japan's energy-import burden, and the 10-year JGB yield declined to 2.48% from 2.50%. The yen was volatile amid speculation about potential intervention but ended the week little changed versus the USD. Wage data were mixed but encouraging from a policy perspective as inflation-adjusted wages rose 1.0% y/y in March, marking the first three-month streak of real wage gains since 2021.
Chinese equities advanced after markets reopened following the May 1–5 holiday. The CSI 300 rose 1.3% and the Shanghai Composite gained 1.7% led by technology and select consumer-related shares. A private-sector survey showed services activity expanding faster than expected, with the China General Services PMI rising to 52.6. Markets were also supported by preparations for the May 14–15 Trump-Xi meeting in Beijing. Hong Kong's Hang Seng rose 2.4%.
| Region | 1 Wk | 1 Mo | 3 Mo | YTD | 1 Yr | 3 Yr | 5 Yr |
|---|---|---|---|---|---|---|---|
| MSCI ACWI | 2.38% | 7.44% | 6.64% | 9.69% | 33.07% | 21.48% | 11.50% |
| MSCI ACWI ex USA | 2.79% | 4.74% | 5.90% | 12.17% | 34.70% | 18.24% | 8.62% |
| MSCI Emerging Markets | 6.90% | 11.28% | 14.15% | 22.51% | 53.96% | 22.88% | 7.47% |
| MSCI Europe | 0.34% | 0.97% | 0.03% | 4.78% | 21.91% | 14.54% | 8.86% |
| MSCI Asia Pacific | 5.65% | 9.03% | 12.08% | 19.78% | 46.05% | 21.18% | 7.90% |
| MSCI Latin America | 0.40% | -0.77% | 1.67% | 19.16% | 51.34% | 18.24% | 11.61% |
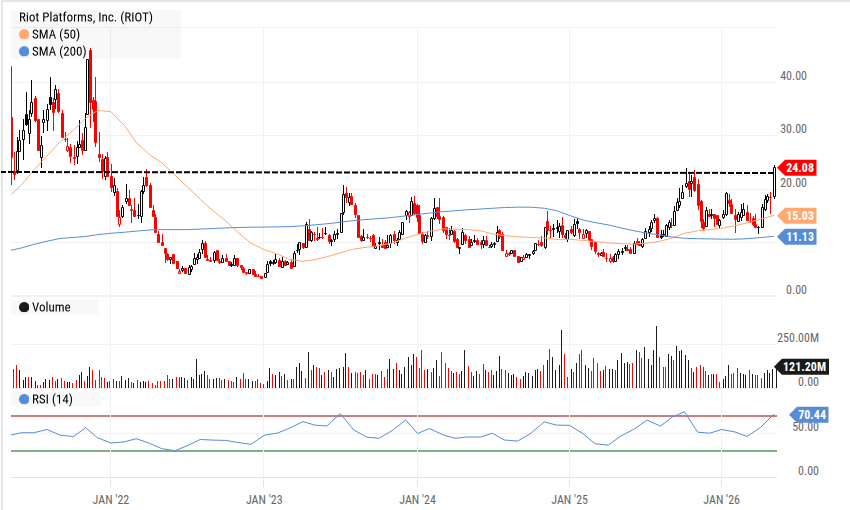
Chart of the Week — 5/11/26
After a sharp downturn starting in early '22, RIOT has been consolidating with prices in a channel between the high single digits and high teens. Recently, RIOT has moved above a long time resistance area, suggesting further gains are ahead.
The Week Ahead
Investors begin the week asking whether ongoing momentum in the AI trade can continue to overshadow higher oil prices and a fragile ceasefire in the Middle East. Earnings reports shift from large cap — only 11 SPX firms are scheduled to report — to the R2K where ~15% of companies will report.
Given the strong advance in technology last week, CSCO (Wed) and AMAT (Thur) will be focus names for the latest on enterprise spending trends while consumer names UA, DDS and YETI will hope to highlight consumer resilience.
Economic data including the CPI (Tues) and PPI (Wed) will be watched for signs of inflation picking up led by higher energy prices in headline reports. CPI core reports last month (March) were a touch light of estimates at 2.6%, as higher apparel prices offset lower used car/truck prices. Likewise, the PPI fell short of mid-4% expectations, coming in at 4%, while the core rose 3.6%, matching the highest level over the past three years.
Retail sales (Thur) is expected to remain robust in the 4% range where it has been for the better part of '24 and '25. President Trump meets with China's Xi later in the week with Middle East events and trade matters, including agriculture and rare earths, likely the major focus points.
| Company | Date | EPS Est. |
|---|---|---|
| Constellation Energy Corp. (CEG) | Mon May 11 | $2.53 |
| Fox Corp. (FOX) | Mon May 11 | $1.08 |
| The Mosaic Co. (MOS) | Mon May 11 | $0.32 |
| Simon Property Group (SPG) | Mon May 11 | $1.49 |
| Under Armour, Inc. (UA) | Tue May 12 | $0.01 |
| Zebra Technologies (ZBRA) | Tue May 12 | $4.20 |
| Cisco Systems, Inc. (CSCO) | Wed May 13 | $1.07 |
| Doximity, Inc. (DOCS) | Wed May 13 | $0.35 |
| Dillard's, Inc. (DDS) | Thu May 14 | $9.86 |
| YETI Holdings, Inc. (YETI) | Thu May 14 | $0.57 |
| Applied Materials (AMAT) | Thu May 14 | $2.90 |
| RBC Bearings, Inc. (RBC) | Fri May 15 | $3.37 |
| Data Release | Date | Est. |
|---|---|---|
| US Existing Home Sales | Mon May 11 | 4.13M |
| Small Business Optimism Index | Tue May 12 | 96.2 |
| US Consumer Price Index YoY | Tue May 12 | 3.6% |
| US Producer Price Index YoY | Wed May 13 | 4.2% |
| Fed Speeches — Kashkari, Logan | Wed May 13 | N/A |
| US Retail Sales YoY | Thu May 14 | 3.3% |
| Empire State Mfg. Index | Fri May 15 | 7.0 |
| US Industrial Production YoY | Fri May 15 | 0.4% |
Key Interest Rates — As of 5/8/26
| Rate | As of | Latest | 1 Mo Ago | 1 Mo % | 1 Yr Ago | 1 Yr % |
|---|---|---|---|---|---|---|
| 1 Month Treasury | 5/8/26 | 3.71% | 3.67% | 1.1% | 4.37% | -15.1% |
| 2 Year Treasury | 5/8/26 | 3.90% | 3.79% | 2.9% | 3.90% | 0.0% |
| 10 Year Treasury | 5/8/26 | 4.38% | 4.29% | 2.1% | 4.37% | 0.2% |
| 30 Year Mortgage | 5/7/26 | 6.37% | 6.46% | -1.4% | 6.76% | -5.8% |
| US Corporate AAA | 5/8/26 | 4.97% | 4.87% | 2.1% | 4.82% | 3.1% |
| US Corporate BBB | 5/8/26 | 5.27% | 5.25% | 0.4% | 5.58% | -5.6% |
| US Corporate CCC | 5/8/26 | 13.19% | 13.42% | -1.7% | 13.30% | -0.8% |
| Effective Fed Funds | 5/7/26 | 3.63% | 3.64% | -0.3% | 4.33% | -16.2% |
US Economy Indicators
| Indicator | As of | Latest | 1 Mo Ago | 1 Mo % | 1 Yr Ago | 1 Yr % |
|---|---|---|---|---|---|---|
| Consumer Sentiment | 4/30/26 | 49.80 | 56.60 | -12.0% | 52.20 | -4.6% |
| Unemployment Rate | 4/30/26 | 4.30% | 4.40% | -2.3% | 4.20% | 2.4% |
| Inflation Rate (CPI YoY) | 3/31/26 | 3.30% | 2.40% | 37.5% | 2.40% | 37.5% |
| Manufacturing PMI | 4/30/26 | 52.70 | 52.40 | 0.6% | 48.70 | 8.2% |
| Non-Manufacturing PMI | 4/30/26 | 53.60 | 56.10 | -4.5% | 51.60 | 3.9% |
| Retail Sales ($M) | 3/31/26 | 651,843 | 639,691 | 1.9% | 625,525 | 4.2% |
| Building Permits (K) | 3/31/26 | 1,372 | 1,538 | -10.8% | 1,481 | -7.4% |
Suggested Readings
- 1Institute for the Study of War: Iran Update Special Report, May 10, 2026
- 2AlphaFold's Surprising Revelation: AI Shifts Bottlenecks, Not Workers
- 3We're Feeling Cynical About xAI's Big Deal With Anthropic
- 4Software Finally Gets To Work: The Opportunity in Vertical AI
- 5EU-Japan Joining Hands To Break China's Supply Chain Grip
Leadership Insight
“Inferencing and Agentic AI are increasing the need for server CPU compute as these workloads require additional CPU processing for orchestration, data movement and parallel execution in addition to serving as the head nodes for GPUs and accelerators.”
Stocks to Consider
For our full list of Stocks To Consider, contact Patrick Mullin at pmullin@timberpointcapital.com
U.S. equities advanced as investors looked past geopolitical volatility and focused on strong earnings, resilient labor data, and continued AI-related momentum. All major indexes were in the green led by the Nasdaq which gained 4.5% spurred on by an 8.4% rise in the technology sector (XLK). The SPX climbed by 2.4% to record highs, while small and mid-cap indexes climbed by 1.7%, also closing at new highs during the week.
Corporate earnings remained strong, with roughly 85% of S&P 500 companies having reported and just under 85% beating consensus estimates (Factset). The technology sector (XLK) was driven by memory names including MU and SNDK, which both gained in excess of 30%, while AMD and INTC posted mid-20% gains as investors sought CPU exposure as their importance to inference tech stacks became more clear. The Energy sector (XLE) was the big loser, down 5.4%, on renewed hopes for fruitful negotiations in the Middle East.
Labor market data were generally firm as initial jobless claims rose to 200K, still below expectations, while continuing claims slipped to 1.77M, the lowest level since 2024. Nonfarm payrolls increased by 115K in April, ahead of estimates, and March payrolls were revised higher to 185K. The unemployment rate held at 4.3%, although labor force participation fell to its lowest level since October 2021.
Treasury yields declined slightly, the 10-year finished at 4.36%, amid lower oil prices and the Treasury Department's quarterly refunding announcement which showed steady borrowing needs. Oil markets were focused on the SoH and brief clashes between U.S. and Iranian forces, but WTI crude ended lower amid Washington's latest peace proposal.
Gold was higher supported by safe-haven demand and China's largest reported monthly purchase in more than a year. Silver and copper advanced, and the USD weakened slightly. The yen was stronger amid signs of potential intervention.
| Asset Class | 1 Wk | 1 Mo | 3 Mo | YTD | 1 Yr | 3 Yr | 5 Yr |
|---|---|---|---|---|---|---|---|
| S&P 500 | 2.36% | 9.16% | 7.06% | 8.52% | 32.27% | 23.06% | 13.45% |
| Dow Jones Industrials | 0.22% | 3.62% | -0.58% | 3.75% | 21.99% | 15.99% | 9.43% |
| NASDAQ | 4.51% | 15.99% | 14.15% | 13.14% | 47.33% | 29.81% | 14.64% |
| S&P MidCap 400 | 1.65% | 9.01% | 4.34% | 13.32% | 30.24% | 16.65% | 8.01% |
| Russell 2000 | 1.72% | 9.23% | 7.48% | 15.70% | 43.03% | 19.36% | 6.16% |
| Russell Micro Cap | 1.97% | 10.30% | 10.01% | 17.85% | 64.13% | 23.72% | 6.35% |
| Sector | 1Wk | YTD |
|---|---|---|
| 1.32% | 0.86% | |
| -1.31% | -5.97% | |
| 0.47% | 14.26% | |
| 0.20% | 10.80% |
| Sector | 1Wk | YTD |
|---|---|---|
| 0.19% | -0.35% | |
| -5.35% | 25.39% | |
| 0.14% | 11.97% | |
| 8.43% | 22.06% |
| Sector | 1Wk | YTD |
|---|---|---|
| 0.01% | 8.97% | |
| -1.15% | -6.93% | |
| -3.93% | 5.48% |
| Style | 1 Wk | 1 Mo | 3 Mo | YTD | 1 Yr | 3 Yr | 5 Yr |
|---|---|---|---|---|---|---|---|
| Large Growth | 3.58% | 14.09% | 11.33% | 6.96% | 35.04% | 27.98% | 14.63% |
| Large Blend | 2.31% | 9.20% | 7.04% | 8.05% | 31.84% | 23.27% | 13.08% |
| Large Value | 0.58% | 2.55% | 0.90% | 9.06% | 25.76% | 17.13% | 10.68% |
| Mid Growth | 1.16% | 6.50% | 5.51% | 3.62% | 13.33% | 16.03% | 6.27% |
| Mid Blend | -0.09% | 3.43% | 2.87% | 6.77% | 19.37% | 16.12% | 7.43% |
| Mid Value | -1.03% | 1.16% | 0.91% | 8.75% | 23.24% | 15.64% | 8.19% |
| Small Growth | 1.78% | 8.22% | 8.54% | 13.87% | 34.00% | 17.81% | 4.95% |
| Small Blend | 1.24% | 5.66% | 4.32% | 12.21% | 30.81% | 17.60% | 6.73% |
| Small Value | 0.82% | 3.77% | 1.28% | 10.96% | 28.42% | 17.40% | 7.91% |
Investors begin the week asking whether ongoing momentum in the AI trade can continue to overshadow higher oil prices and a fragile ceasefire in the Middle East. Earnings reports shift from large cap — only 11 SPX firms are scheduled to report — to the R2K where ~15% of companies will report.
Given the strong advance in technology last week, CSCO (Wed) and AMAT (Thur) will be focus names for the latest on enterprise spending trends while consumer names UA, DDS and YETI will hope to highlight consumer resilience.
Economic data including the CPI (Tues) and PPI (Wed) will be watched for signs of inflation picking up led by higher energy prices in headline reports. CPI core reports last month (March) were a touch light of estimates at 2.6%, as higher apparel prices offset lower used car/truck prices.
Retail sales (Thur) is expected to remain robust in the 4% range. President Trump meets with China's Xi later in the week with Middle East events and trade matters, including agriculture and rare earths, likely the major focus points.
| Company | Date | EPS Est. |
|---|---|---|
| Constellation Energy Corp. (CEG) | Mon May 11 | $2.53 |
| Fox Corp. (FOX) | Mon May 11 | $1.08 |
| The Mosaic Co. (MOS) | Mon May 11 | $0.32 |
| Simon Property Group (SPG) | Mon May 11 | $1.49 |
| Under Armour, Inc. (UA) | Tue May 12 | $0.01 |
| Zebra Technologies (ZBRA) | Tue May 12 | $4.20 |
| Cisco Systems, Inc. (CSCO) | Wed May 13 | $1.07 |
| Doximity, Inc. (DOCS) | Wed May 13 | $0.35 |
| Dillard's, Inc. (DDS) | Thu May 14 | $9.86 |
| YETI Holdings, Inc. (YETI) | Thu May 14 | $0.57 |
| Applied Materials (AMAT) | Thu May 14 | $2.90 |
| RBC Bearings, Inc. (RBC) | Fri May 15 | $3.37 |
| Data Release | Date | Est. |
|---|---|---|
| US Existing Home Sales | Mon May 11 | 4.13M |
| Small Business Optimism Index | Tue May 12 | 96.2 |
| US Consumer Price Index YoY | Tue May 12 | 3.6% |
| US Producer Price Index YoY | Wed May 13 | 4.2% |
| Fed Speeches — Kashkari, Logan | Wed May 13 | N/A |
| US Retail Sales YoY | Thu May 14 | 3.3% |
| Empire State Mfg. Index | Fri May 15 | 7.0 |
| US Industrial Production YoY | Fri May 15 | 0.4% |
In Europe, the STOXX Europe 600 finished with modest gains, while Germany's DAX rose 0.2%, Italy's FTSE MIB gained 2.2%, France's CAC 40 was little changed, and the UK's FTSE 100 fell 1.3%. Sentiment improved early in the week on better Middle East headlines and solid corporate earnings but weakened later after President Trump threatened higher tariffs on the EU. Eurozone producer prices rose at the fastest monthly pace since 2022, German factory orders jumped 5.0%, and the UK Composite PMI rose to 52.6.
Japanese markets rallied during a holiday-shortened week as the Nikkei 225 surged 5.4% to a record high, while the TOPIX gained 2.7%, led by technology and semiconductor shares and AI demand optimism. Falling oil prices helped ease concerns about Japan's energy-import burden, and the 10-year JGB yield declined to 2.48% from 2.50%. Inflation-adjusted wages rose 1.0% y/y in March, marking the first three-month streak of real wage gains since 2021.
Chinese equities advanced after markets reopened following the May 1–5 holiday. The CSI 300 rose 1.3% and the Shanghai Composite gained 1.7% led by technology and select consumer-related shares. The China General Services PMI rose to 52.6. Markets were supported by preparations for the May 14–15 Trump-Xi meeting in Beijing. Hong Kong's Hang Seng rose 2.4%.
| Region | 1 Wk | 1 Mo | 3 Mo | YTD | 1 Yr | 3 Yr | 5 Yr |
|---|---|---|---|---|---|---|---|
| MSCI ACWI | 2.38% | 7.44% | 6.64% | 9.69% | 33.07% | 21.48% | 11.50% |
| MSCI ACWI ex USA | 2.79% | 4.74% | 5.90% | 12.17% | 34.70% | 18.24% | 8.62% |
| MSCI Emerging Markets | 6.90% | 11.28% | 14.15% | 22.51% | 53.96% | 22.88% | 7.47% |
| MSCI Europe | 0.34% | 0.97% | 0.03% | 4.78% | 21.91% | 14.54% | 8.86% |
| MSCI Asia Pacific | 5.65% | 9.03% | 12.08% | 19.78% | 46.05% | 21.18% | 7.90% |
| MSCI Latin America | 0.40% | -0.77% | 1.67% | 19.16% | 51.34% | 18.24% | 11.61% |
| Rate | Latest | 1 Mo Ago | 1 Mo % | 1 Yr Ago | 1 Yr % |
|---|---|---|---|---|---|
| 1 Month Treasury | 3.71% | 3.67% | 1.1% | 4.37% | -15.1% |
| 2 Year Treasury | 3.90% | 3.79% | 2.9% | 3.90% | 0.0% |
| 10 Year Treasury | 4.38% | 4.29% | 2.1% | 4.37% | 0.2% |
| 30 Year Mortgage | 6.37% | 6.46% | -1.4% | 6.76% | -5.8% |
| US Corporate AAA | 4.97% | 4.87% | 2.1% | 4.82% | 3.1% |
| US Corporate BBB | 5.27% | 5.25% | 0.4% | 5.58% | -5.6% |
| US Corporate CCC | 13.19% | 13.42% | -1.7% | 13.30% | -0.8% |
| Effective Fed Funds | 3.63% | 3.64% | -0.3% | 4.33% | -16.2% |
| Indicator | Latest | 1 Mo Ago | 1 Mo % | 1 Yr Ago | 1 Yr % |
|---|---|---|---|---|---|
| Consumer Sentiment | 49.80 | 56.60 | -12.0% | 52.20 | -4.6% |
| Unemployment Rate | 4.30% | 4.40% | -2.3% | 4.20% | 2.4% |
| Inflation Rate (CPI YoY) | 3.30% | 2.40% | 37.5% | 2.40% | 37.5% |
| Manufacturing PMI | 52.70 | 52.40 | 0.6% | 48.70 | 8.2% |
| Non-Manufacturing PMI | 53.60 | 56.10 | -4.5% | 51.60 | 3.9% |
| Retail Sales ($M) | 651,843 | 639,691 | 1.9% | 625,525 | 4.2% |
| Building Permits (K) | 1,372 | 1,538 | -10.8% | 1,481 | -7.4% |
After a sharp downturn starting in early '22, RIOT has been consolidating with prices in a channel between the high single digits and high teens. Recently, RIOT has moved above a long time resistance area, suggesting further gains are ahead.
“Inferencing and Agentic AI are increasing the need for server CPU compute as these workloads require additional CPU processing for orchestration, data movement and parallel execution in addition to serving as the head nodes for GPUs and accelerators.”
©2020 YCharts, Inc. All Rights Reserved. YCharts, Inc. ("YCharts") is not registered with the U.S. Securities and Exchange Commission as an investment adviser, broker-dealer or in any other capacity, and does not purport to provide investment advice or make investment recommendations. This report has been generated through application of the analytical tools and data provided through ycharts.com and is intended solely to assist you or your investment or other adviser(s) in conducting investment research.
All data, statistics and charts are courtesy of YCharts unless otherwise noted. Investment Advice is offered through Fortis Capital Advisors, LLC, 7301 Mission Road, Suite 326, Prairie Village, KS 66208.
While reasonable efforts were used to obtain information from sources believed to be reliable, Fortis Capital Advisors, LLC makes no representation that the information or opinions contained in this material are accurate, reliable, or complete. All information and opinions are subject to change without notice. You should not construe this report as an offer to buy or sell, as a solicitation of an offer to buy or sell, or as a recommendation to buy, sell, hold or trade, any security or other financial instrument.
Past performance is not indicative of future results. Investing involves risk, including the possible loss of principal. The information contained herein is provided for informational purposes only and should not be construed as investment, tax, or legal advice. Recipients should consult their own advisers before making any investment decisions.
Source: Timber Point Capital Management. Powered by Fortis Capital Advisors. Investment Advice is offered through Fortis Capital Advisors, LLC, 7301 Mission Road, Suite 326, Prairie Village, KS 66208. All rights reserved.